|
|
|
|
Hubbert math |
We define:
The Hubbert's equation can be expressed in four forms. First, the differential form
This equation is non-linear in 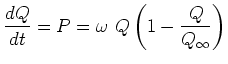 but
it reduces to familiar linear equations near the beginning and
but
it reduces to familiar linear equations near the beginning and
![]() and near the end at
and near the end at
![]() .
As production begins and
.
As production begins and
![]() is small, equation (1) reduces to
is small, equation (1) reduces to
![]() which displays exponential growth at a rate
which displays exponential growth at a rate ![]() .
As production ends near
.
As production ends near
![]() the non-linear equation reduces to exponential decay.
To prove this fact change variables from to
the non-linear equation reduces to exponential decay.
To prove this fact change variables from to ![]() by inserting
by inserting
![]() . Then evaluate the result at small
. Then evaluate the result at small ![]() .
The form (1) exhibits growth and decay as a dynamic process.
.
The form (1) exhibits growth and decay as a dynamic process.
The second form of the Hubbert equation is found
by dividing equation (1) by .
It is sometimes called the
Hubbert Linearization.
The important thing about this equation is that it is linear
in the two variables and 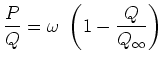 .
If you have historical measurements of
.
If you have historical measurements of ![]() and
and ![]() ,
you can plot these points in the
,
you can plot these points in the ![]() -plane
and hope for them to reasonably fit a straight line.
Fitting the best line to the scattered points we can read the axis intercepts.
At
-plane
and hope for them to reasonably fit a straight line.
Fitting the best line to the scattered points we can read the axis intercepts.
At ![]() with equation (2) we can read off the value of the growth/decay parameter
with equation (2) we can read off the value of the growth/decay parameter
![]() .
For world oil, according to Deffeyes
(Remember! The references are links on the web version of this paper.)
it is 5.3 percent/year.
At the other intercept,
.
For world oil, according to Deffeyes
(Remember! The references are links on the web version of this paper.)
it is 5.3 percent/year.
At the other intercept, ![]() we must have
we must have
![]() .
According to Deffeyes,
.
According to Deffeyes,
![]() is two trillion barrels.
is two trillion barrels.
The third form of Hubbert's equation is the one best known.
It looks like a Gaussian,
but it isn't.
(A Gaussian decays much faster.)
The current production ![]() is
is
This is the equation of a blob, also known as ``Hubbert's pimple'', symmetric
about the point 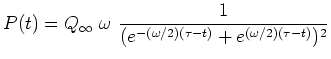 .
Asymptotically it decreases (or increases) exponentially towards its maximum
value at the center at .
The function resembles a Gaussian but exponential decay
is much weaker than Gaussian decay.
Exponential growth is common in ecological systems
which may also decay exponentially as resources are depleted or predator
numbers grow exponentially.
.
Asymptotically it decreases (or increases) exponentially towards its maximum
value at the center at .
The function resembles a Gaussian but exponential decay
is much weaker than Gaussian decay.
Exponential growth is common in ecological systems
which may also decay exponentially as resources are depleted or predator
numbers grow exponentially.
All that remains is to figure out ![]() .
The Hubbert curve is symmetrical and reaches its maximum
when half the oil is gone.
That happens when
.
The Hubbert curve is symmetrical and reaches its maximum
when half the oil is gone.
That happens when
![]() .
In the case of USA production which has passed its peak
we can find the year that reached that value (about 1973).
There is some debate about what year world production peaks, but general agreement is that it is about now (2008).
Under Hubbert assumptions the decline curve is a mirror of the rise curve.
That means we start down gently over the next decade,
but about 25 years from now we hit the inflection point
and see a 5 percent/year decline every year thereafter.
.
In the case of USA production which has passed its peak
we can find the year that reached that value (about 1973).
There is some debate about what year world production peaks, but general agreement is that it is about now (2008).
Under Hubbert assumptions the decline curve is a mirror of the rise curve.
That means we start down gently over the next decade,
but about 25 years from now we hit the inflection point
and see a 5 percent/year decline every year thereafter.
In real life there is no reason for the decay rate to match the growth rate. The decay could be faster because of horizontal drilling. The decay could be slower because we tax to conserve or successfully invest in technologies. As liquid oil depletes, society is switching to mining tar sands.
The Hubbert equation,
in all its forms,
follows as a consequence of the definition of the ``logistic'' function ![]() .
It ranges from 0 in the past to
.
It ranges from 0 in the past to ![]() in the future.
in the future.
|
|
|
|
Hubbert math |