|
|
|
|
An image-focusing semblance functional for velocity analysis |
In the previous section, I showed that we can measure image coherency across the structural dip axes to extract focusing information from stacked images. I also showed the shortcomings of this procedure in presence of reflector's curvature. In this section, I introduce a generalization of the semblance functional that measures coherency simultaneously along the dip axes and the aperture/azimuth axes. I name this semblance functional the Image-focusing semblance. In 2D it is defined as:
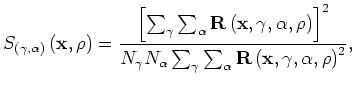 is the number of aperture angles
to be included in the computation.
is the number of aperture angles
to be included in the computation.
As discussed in the previous section, the polarity of reflectors' truncation reverses at the reflectors' dip (Figure 8.) The semblance functional introduced in equation 5 can be modified to better measure image focusing of reflectors' truncation in a way analogous to the way I modified equation 3 to become equation 4. For reflector truncations, the image-focusing semblance can thus be computed as:
To better evaluate the amount of additional information provided by measuring coherency along the structural dips, I also computed a conventional semblance functional that measured coherency only along the aperture angle from the residual prestack migration results. I computed this conventional semblance function according to the following expression:
The ![]() spectrum shown in Figure 11a
was computed by applying equation 7.
To compute the
spectrum shown in Figure 11a
was computed by applying equation 7.
To compute the ![]() spectrum shown in Figure 11b
I used a combination of the semblance functional expressed in
equation 5 for the two shallower events,
and of the semblance functional expressed in
equation 6 for the deepest event,
which corresponds to the reflector's truncation.
The semblance peak corresponding to the point diffractor
(the top event) is much sharper in
Figure 11b than in
Figure 11a.
This result confirms that the use of
image-focusing semblance instead of conventional semblance
has the potential of enhancing velocity estimation.
In Figure 11b
the semblance peaks corresponding to the planar dipping event
(second from the top) and the reflector's truncation (first from the bottom)
are substantially smaller than the one for the point diffractor,
but are still located at the correct value of
spectrum shown in Figure 11b
I used a combination of the semblance functional expressed in
equation 5 for the two shallower events,
and of the semblance functional expressed in
equation 6 for the deepest event,
which corresponds to the reflector's truncation.
The semblance peak corresponding to the point diffractor
(the top event) is much sharper in
Figure 11b than in
Figure 11a.
This result confirms that the use of
image-focusing semblance instead of conventional semblance
has the potential of enhancing velocity estimation.
In Figure 11b
the semblance peaks corresponding to the planar dipping event
(second from the top) and the reflector's truncation (first from the bottom)
are substantially smaller than the one for the point diffractor,
but are still located at the correct value of ![]() .
The relative scaling between the semblance peaks
could be improved.
.
The relative scaling between the semblance peaks
could be improved.
Figure 12 compares
conventional aperture-angle ![]() spectrum
with the proposed image-focusing spectrum evaluated
at the horizontal location of the bottom of the syncline
in the model shown in Figure 2a.
Both spectra peak for the correct value of
spectrum
with the proposed image-focusing spectrum evaluated
at the horizontal location of the bottom of the syncline
in the model shown in Figure 2a.
Both spectra peak for the correct value of ![]() ;
that is
;
that is ![]() .
The spectrum computed using the proposed method has a small
secondary peak for low
.
The spectrum computed using the proposed method has a small
secondary peak for low ![]() s, but not as strong as the one
for only-dip spectrum (Figure 9c)
or the varimax norm (Figure 5a.)
Similarly, the spectra computed at the horizontal location
of the top of the anticline
in the same model
peak for the correct value of
s, but not as strong as the one
for only-dip spectrum (Figure 9c)
or the varimax norm (Figure 5a.)
Similarly, the spectra computed at the horizontal location
of the top of the anticline
in the same model
peak for the correct value of ![]() ,
as shown in Figure 13.
,
as shown in Figure 13.
|
Sembl-4700-both-overn
Figure 11. Semblance |

|
|---|---|
|
|
|
Sembl-4250-both-overn
Figure 12. Semblance |

|
|---|---|
|
|
|
Sembl-4750-both-overn
Figure 13. Semblance |

|
|---|---|
|
|
|
|
|
|
An image-focusing semblance functional for velocity analysis |
![$\displaystyle S_\gamma \left({\bf x},\rho\right)= \frac{ \left[\sum_\gamma {\bf...
...ht]^2 } { N_{\gamma } \sum_\gamma {\bf R}\left({\bf x},\gamma ,\rho\right)^2 }.$](img38.png)