|
|
|
|
An image-focusing semblance functional for velocity analysis |
As an alternative to minimizing entropy, in this paper I propose to measure image focusing by maximizing coherency along both the structural-dip axes and the aperture/azimuth axes. The simultaneous use of dips and aperture angles is discussed in the next section. In this section, I show that measuring coherency along the structural dips does provide information on image focusing and I illustrate the concept by using the same two 2D synthetic data sets shown above. I will also demonstrate that maximizing coherency only along the structural dips may lead us to similar problems as the minimization of entropy.
To measure coherency along the structural dip ![]() ,
I first create
the dip-decomposed prestack image
,
I first create
the dip-decomposed prestack image
![]() by residual prestack migration,
and then
I compute the following semblance functional:
by residual prestack migration,
and then
I compute the following semblance functional:
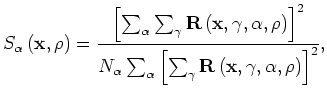 is the number of dips to be included in the computation.
Notice that, as for the varimax in equation 2,
semblance along structural dips is computed
after stacking over the aperture angle
is the number of dips to be included in the computation.
Notice that, as for the varimax in equation 2,
semblance along structural dips is computed
after stacking over the aperture angle
The determination of the dip summation range at each image location
and for each value of the parameter ![]() is a practical problem
of the proposed method.
For the examples shown in this paper I determined the
summation ranges for both
is a practical problem
of the proposed method.
For the examples shown in this paper I determined the
summation ranges for both ![]() and
and ![]() by applying
an amplitude thresholding criterion
based on both local and global amplitude maxima
measured from the images.
To improve the smoothness of the semblance spectra,
I averaged the evaluation of equation 3,
and of all the other semblance functionals introduced in this paper,
over spatial windows extending along both the
by applying
an amplitude thresholding criterion
based on both local and global amplitude maxima
measured from the images.
To improve the smoothness of the semblance spectra,
I averaged the evaluation of equation 3,
and of all the other semblance functionals introduced in this paper,
over spatial windows extending along both the ![]() and
and ![]() directions.
directions.
|
Dips-4700-diffr-overn
Figure 7. a) Dip-decomposed stack image of the diffractor-point window as a function of the dip angle extracted at |

|
|---|---|
|
|
|
Dips-4700-trunc-overn
Figure 8. a) Dip-decomposed stack image of the reflector-truncation window as a function of the dip angle extracted at |

|
|---|---|
|
|
Figure 7a
shows the dip-decomposed stack image
of the diffractor-point window as a function of the dip angle
![]() extracted from
extracted from
![]() at the point-diffractor's horizontal position and
for
at the point-diffractor's horizontal position and
for
![]() ;
that is, the correct value of
;
that is, the correct value of ![]() .
The image is consistent as a function of dips,
with the exception of an image artifact caused
by interference with the image from the planar reflectors
below the point diffractor.
Figure 7b
shows the semblance computed by applying
equation 3
at the horizontal position of the point diffractor.
It has a sharp peak for
.
The image is consistent as a function of dips,
with the exception of an image artifact caused
by interference with the image from the planar reflectors
below the point diffractor.
Figure 7b
shows the semblance computed by applying
equation 3
at the horizontal position of the point diffractor.
It has a sharp peak for
![]() .
The dip-coherency analysis has thus the
potential to provide accurate velocity information.
.
The dip-coherency analysis has thus the
potential to provide accurate velocity information.
Figure 8a
shows the dip-decomposed stack image
of the reflector-truncation window as a function of the dip angle
![]() at extracted from
at extracted from
![]() at the horizontal position of the reflector's truncation
for
at the horizontal position of the reflector's truncation
for ![]() ;
that is, the correct value of
;
that is, the correct value of ![]() .
The dip-decomposed image is strongly peaked at
.
The dip-decomposed image is strongly peaked at
![]() ;
that is the dip of the reflector.
The event is weak away from
;
that is the dip of the reflector.
The event is weak away from
![]() ;
and much weaker than the
point-diffractor event shown in
Figure 7a.
Furthermore, polarity of the event switches at
;
and much weaker than the
point-diffractor event shown in
Figure 7a.
Furthermore, polarity of the event switches at
![]() .
At the transition corresponding to the reflector dip,
the image is actually rotated by 45 degrees.
To compute a higher-quality semblance spectrum,
I zeroed the image at
.
At the transition corresponding to the reflector dip,
the image is actually rotated by 45 degrees.
To compute a higher-quality semblance spectrum,
I zeroed the image at
![]() and split the computation of the numerator in equation 3
between dips larger than 15 degrees and
dips smaller than 15 degrees;
that is I computed the following modified semblance functional:
and split the computation of the numerator in equation 3
between dips larger than 15 degrees and
dips smaller than 15 degrees;
that is I computed the following modified semblance functional:
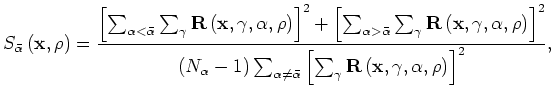 is the structural dip of the truncated reflector.
The need to identify a reflector truncation and to estimate
the local dip of the reflector is potentially a practical
problem with using dip coherency to extract velocity information
from reflector's truncations.
is the structural dip of the truncated reflector.
The need to identify a reflector truncation and to estimate
the local dip of the reflector is potentially a practical
problem with using dip coherency to extract velocity information
from reflector's truncations.
The semblance spectrum shown
in Figure 8b was computed
by applying equation 4
with
![]() .
The semblance peak is at the correct value
of
.
The semblance peak is at the correct value
of ![]() but it is much broader than the
peak corresponding to the point diffractor
shown in Figure 7b.
As noted when comparing
Figure 3a with
Figure 4a,
the velocity
information provided by focusing analysis of reflectors'
truncations seems to be more difficult to use
than the one provided by point diffractors.
but it is much broader than the
peak corresponding to the point diffractor
shown in Figure 7b.
As noted when comparing
Figure 3a with
Figure 4a,
the velocity
information provided by focusing analysis of reflectors'
truncations seems to be more difficult to use
than the one provided by point diffractors.
The computation of the dip spectra for the data set with sinusoidal
reflector illustrates the limitations and potential dangers
of relying on dip-only spectra when continuous
reflectors have a strong curvature.
Figures 9a and 9b
show the image decomposed according to structural
dips for the bottom of the syncline window
for two different values of ![]() :
:
![]() for Figure 9a,
and
for Figure 9a,
and
![]() for Figure 9b
(same values of
for Figure 9b
(same values of ![]() as for Figure 5c and
Figure 5b, respectively.)
The image is flat as a function
of the dip angle for the wrong value of
as for Figure 5c and
Figure 5b, respectively.)
The image is flat as a function
of the dip angle for the wrong value of ![]() and is frowning for the correct value of
and is frowning for the correct value of ![]() .
Consequently the dip spectrum shown in
Figure 9c peaks at a low value
of
.
Consequently the dip spectrum shown in
Figure 9c peaks at a low value
of ![]() and would mislead velocity estimation.
and would mislead velocity estimation.
The analysis of Figure 10
leads to similar conclusions.
In this case the image is flat for a higher
value of ![]() (
(
![]() ) than the
correct one (
) than the
correct one (
![]() ),
for which the image is actually smiling.
The semblance spectrum is also biased toward higher
values of
),
for which the image is actually smiling.
The semblance spectrum is also biased toward higher
values of ![]() .
.
|
Dips-4250-overn
Figure 9. a) Dip-decomposed stack image of the bottom of the syncline window as a function of the dip angle extracted at |

|
|---|---|
|
|
|
Dips-4750-overn
Figure 10. a) Dip-decomposed stack image of the top of the anticline window as a function of the dip angle extracted at |

|
|---|---|
|
|
|
|
|
|
An image-focusing semblance functional for velocity analysis |