|
|
|
|
Hypercube viewer |
The Main sub-menu allows you to set the perspective, the font size, and whether or not to draw a colorbar. You have six perspective options, three that view a single slice of the data, and three that view multiple slices of the data. The three single slice options are FRONT, SIDE, and TOP; these correspond to viewing slices containing the 1-2, 1-3 and 2-3 axes, respectively. In addition, you can see a plan view THREE, a cube-view CUBE, and cut CUT into the data. The font menu allows you to control the font used to draw the axes, and the colorbar allows you to view a colorbar with a superimposed histogram.
The Save sub-menu allows you to save the current view as a ppm file or a large or small postscript file. The small postscript option is appropriate for inclusion in presentations while the large option's 1200 DPI is appropriate for papers. The large option is quite time consuming because it redraws the current view at approximately 64 times the resolution of a standard screen.
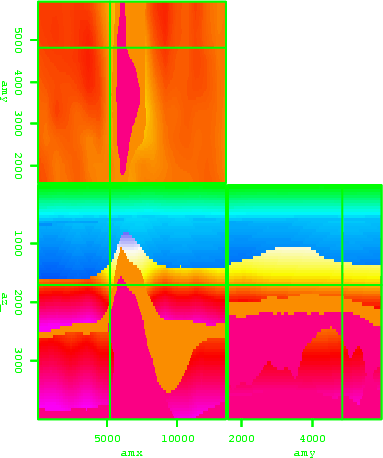
The Data and Overlay sub-menus are only available when using multiple datasets. The Data sub-menu allows you to choose which dataset, or combination of datasets you wish to see in the current view. You have the option of selecting any of the current datasets or overlaying two datasets. The overlay is done by modifying the opacity channel of the overlying dataset. Figure 3 shows an example of overlaying a velocity model and a migrated image. The figure itself is generated through Save menu. You can control the level of opacity through the Opacity sub-menu. In addition, you can change the colormap of the overlying dataset in this menu. With the Cycle button in the View sub-menu you can cycle through all of the datasets.
|
overlay
Figure 3. An example of overlaying a velocity model on top of a migrated image. [NR] |
|
|---|---|
|
|
|
|
|
|
Hypercube viewer |