|
|
|
|
|
|---|
|
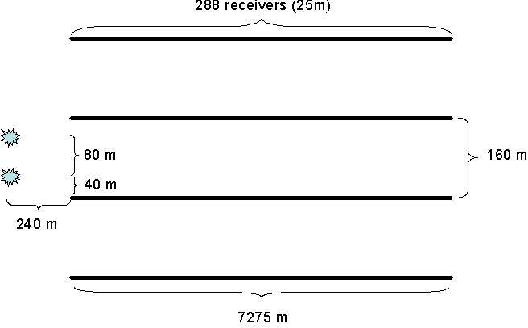
acq-sktch1
Figure 1. Sketch of the basic acquisition geometry |
|
|
|
|---|
|
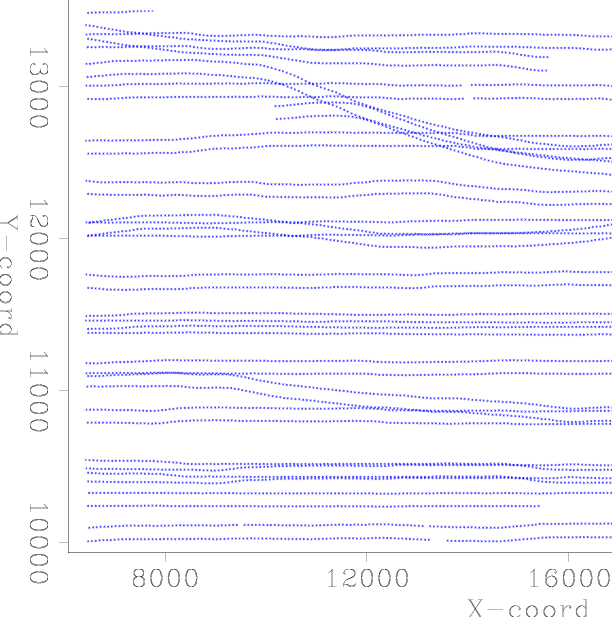
shots-map
Figure 2. Map view of the source locations. |
|
|
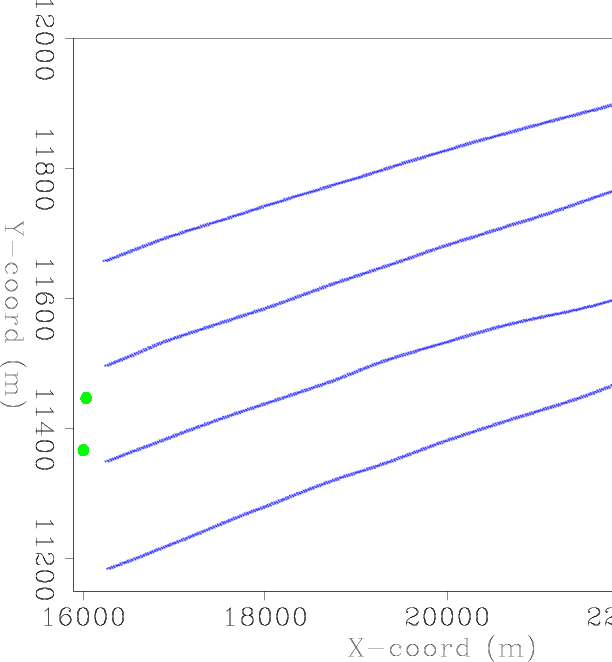
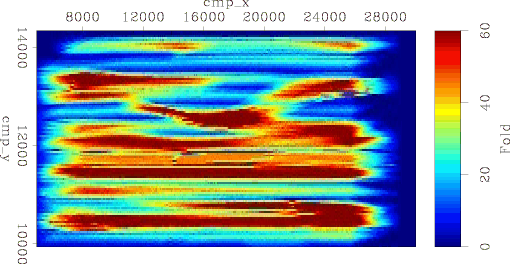
The strong currents present in the area caused significant feathering. Figure 3 shows an example for the sail-line at cross-line distance 11440 m (see Figure 2. The feathering angle is about 25 deg with respect to the inline direction. For most shots, the feathering was in the same South-North direction. Figure 4 shows the fold of coverage that in some places depart significantly from its design value of 48. Some of the short source lines in Figure 2 were acquired as infill to avoid large coverage holes.
|
|---|
|
feathering
Figure 3. Map view of the receiver cables for one shot illustrating typical feathering. The feathering angle is about 25 deg with respect to the inline direction. |
|
|
|
|---|
|
fold
Figure 4. Fold map illustrating relatively uniform coverage. |
|
|
|
|
|
|