

Next: Discrimination of multiples
Up: Alvarez: Multiple imaging
Previous: Raw data
In order to efficiently migrate the data with shot profile migration, I removed the time samples before
the water-bottom arrival and compensated by applying a linear frequency shift to the source
wavelet. The propagation through the water layer was done in two depth steps and from
there down the depth sampling was 10 m. For the sake of computer time, only two reference
velocities were used to propagate the data at each depth step. These reference velocities
were computed with Lloyd's algorithm Clapp (2004). The aperture in the inline direction was 9 km
(1.2 km in front of the streamer and 0.6 km at the end of the streamer) and the cross-line aperture
was 4.8 km
(2.4 km in the up-dip direction and 1.4 km in the down-dip direction). Four hundred frequencies
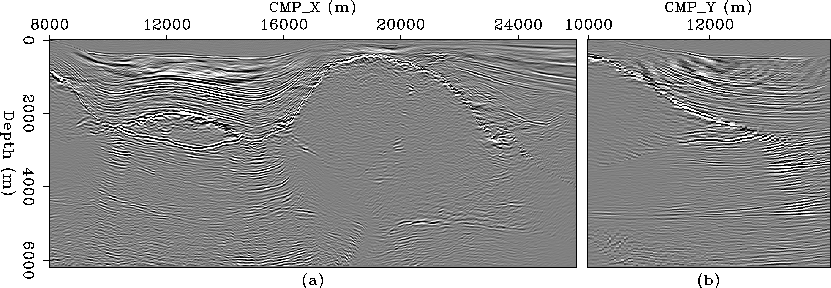
were used from 6 to 40 Hz. Figure ![[*]](http://sepwww.stanford.edu/latex2html/cross_ref_motif.gif) shows an inline and a cross-line sections
taken from the migrated cube. The depth axis is with respect to an arbitrary reference. The inline
section is at crossline 10240 m and the crossline section
is taken at inline 12000 m. The migrated data was filtered in depth and a gain proportional
to the depth squared was applied for display purposes.
mignooffs1
shows an inline and a cross-line sections
taken from the migrated cube. The depth axis is with respect to an arbitrary reference. The inline
section is at crossline 10240 m and the crossline section
is taken at inline 12000 m. The migrated data was filtered in depth and a gain proportional
to the depth squared was applied for display purposes.
mignooffs1
Figure 8 Shot profile migration. Panel (a) is the inline section at crossline
11440 m. Panel (b) is the crossline section at inline 12000 m.


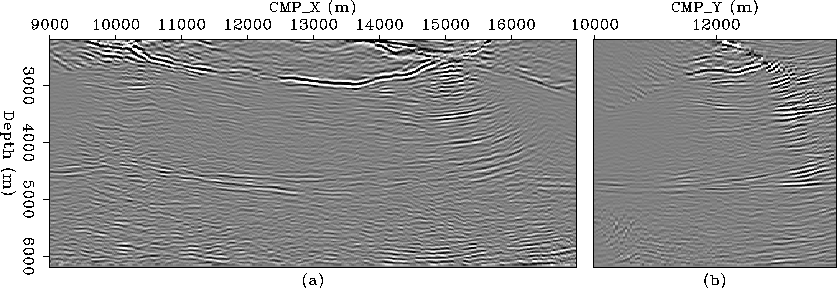
Since it is not easy to identify the multiples in Figure ![[*]](http://sepwww.stanford.edu/latex2html/cross_ref_motif.gif) , I windowed the
image below the salt body between 8000 and 16000 m in the inline direction as shown in
Figure
, I windowed the
image below the salt body between 8000 and 16000 m in the inline direction as shown in
Figure ![[*]](http://sepwww.stanford.edu/latex2html/cross_ref_motif.gif) . The crossing events are an indication of the presence of the
migrated multiples and their interference with the legitimate, possibly weak subsalt primaries.
Again, it is not immediately obvious which of these reflections are primaries and which are
multiples without the help of prestack migrated images as a function of subsurface offset or
aperture and azimuth angles. Computing subsurface offsets, however, is very expensive and at the
time of this report I have computed only inline subsurface offsets and only for one sail line.
The results are presented in the next section.
. The crossing events are an indication of the presence of the
migrated multiples and their interference with the legitimate, possibly weak subsalt primaries.
Again, it is not immediately obvious which of these reflections are primaries and which are
multiples without the help of prestack migrated images as a function of subsurface offset or
aperture and azimuth angles. Computing subsurface offsets, however, is very expensive and at the
time of this report I have computed only inline subsurface offsets and only for one sail line.
The results are presented in the next section.
mignooffs1_win
Figure 9 Close up view of the migrated cube to show the interference between
the multiples and the weak subsalt primaries. Panel (a) is the inline section at crossline
11440 m. Panel (b) is the crossline section at inline 12000 m.


Next: Discrimination of multiples
Up: Alvarez: Multiple imaging
Previous: Raw data
Stanford Exploration Project
5/6/2007

![[*]](http://sepwww.stanford.edu/latex2html/cross_ref_motif.gif) shows an inline and a cross-line sections
taken from the migrated cube. The depth axis is with respect to an arbitrary reference. The inline
section is at crossline 10240 m and the crossline section
is taken at inline 12000 m. The migrated data was filtered in depth and a gain proportional
to the depth squared was applied for display purposes.
shows an inline and a cross-line sections
taken from the migrated cube. The depth axis is with respect to an arbitrary reference. The inline
section is at crossline 10240 m and the crossline section
is taken at inline 12000 m. The migrated data was filtered in depth and a gain proportional
to the depth squared was applied for display purposes.

![[*]](http://sepwww.stanford.edu/latex2html/cross_ref_motif.gif) , I windowed the
image below the salt body between 8000 and 16000 m in the inline direction as shown in
Figure
, I windowed the
image below the salt body between 8000 and 16000 m in the inline direction as shown in
Figure ![[*]](http://sepwww.stanford.edu/latex2html/cross_ref_motif.gif) . The crossing events are an indication of the presence of the
migrated multiples and their interference with the legitimate, possibly weak subsalt primaries.
Again, it is not immediately obvious which of these reflections are primaries and which are
multiples without the help of prestack migrated images as a function of subsurface offset or
aperture and azimuth angles. Computing subsurface offsets, however, is very expensive and at the
time of this report I have computed only inline subsurface offsets and only for one sail line.
The results are presented in the next section.
. The crossing events are an indication of the presence of the
migrated multiples and their interference with the legitimate, possibly weak subsalt primaries.
Again, it is not immediately obvious which of these reflections are primaries and which are
multiples without the help of prestack migrated images as a function of subsurface offset or
aperture and azimuth angles. Computing subsurface offsets, however, is very expensive and at the
time of this report I have computed only inline subsurface offsets and only for one sail line.
The results are presented in the next section.
