

Next: Velocity model
Up: Description of the data
Previous: Description of the data
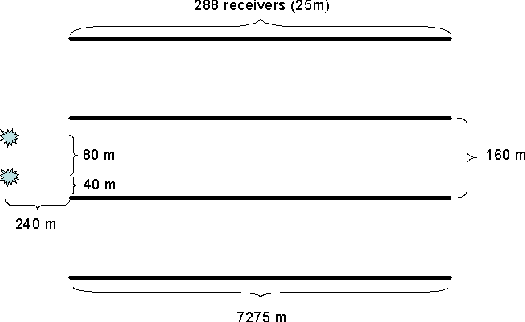
The 3D dataset consists of 20 sail lines each with four
active streamers and dual flip-flop shooting. The separation between streamers is 160 m
and between receivers is 25 m. The shot interval is 37.5 m (between the flip and the flop).
The minimum offset inline is 240 m and each streamer has 288 receivers for a maximum
inline offset of 7175 m. Figure ![[*]](http://sepwww.stanford.edu/latex2html/cross_ref_motif.gif) shows the acquisition template.
Figure
shows the acquisition template.
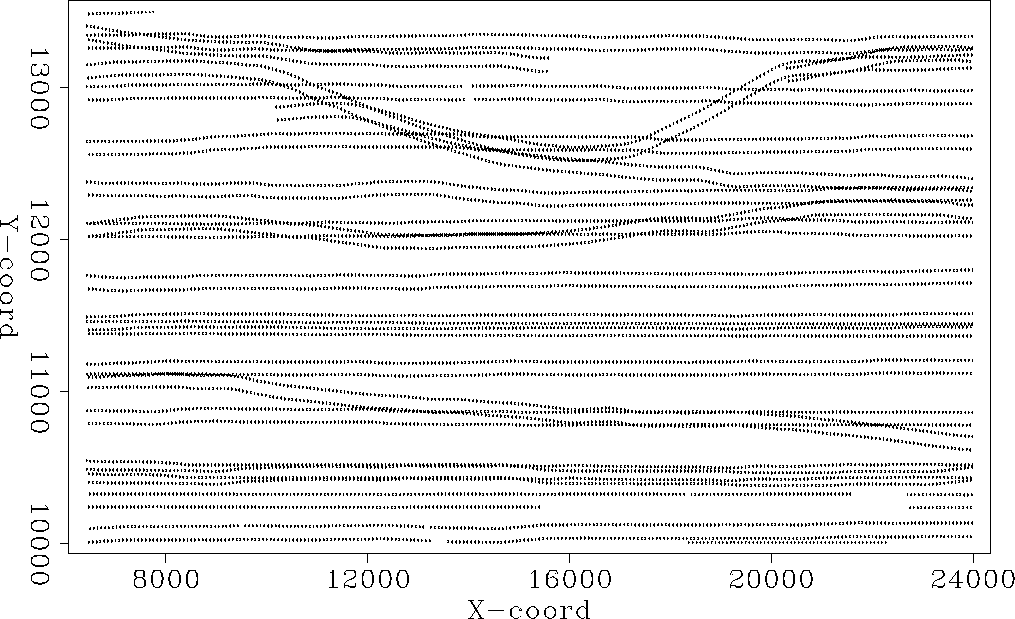
Figure ![[*]](http://sepwww.stanford.edu/latex2html/cross_ref_motif.gif) shows a map view of the subset of the shots used in this study.
Although most sail lines were straight in the East-West direction, a few had significant
curvature.
acq_sktch1
shows a map view of the subset of the shots used in this study.
Although most sail lines were straight in the East-West direction, a few had significant
curvature.
acq_sktch1
Figure 1 Sketch of the basic acquisition geometry
 shots_map
Figure 2 Map view of the source locations.


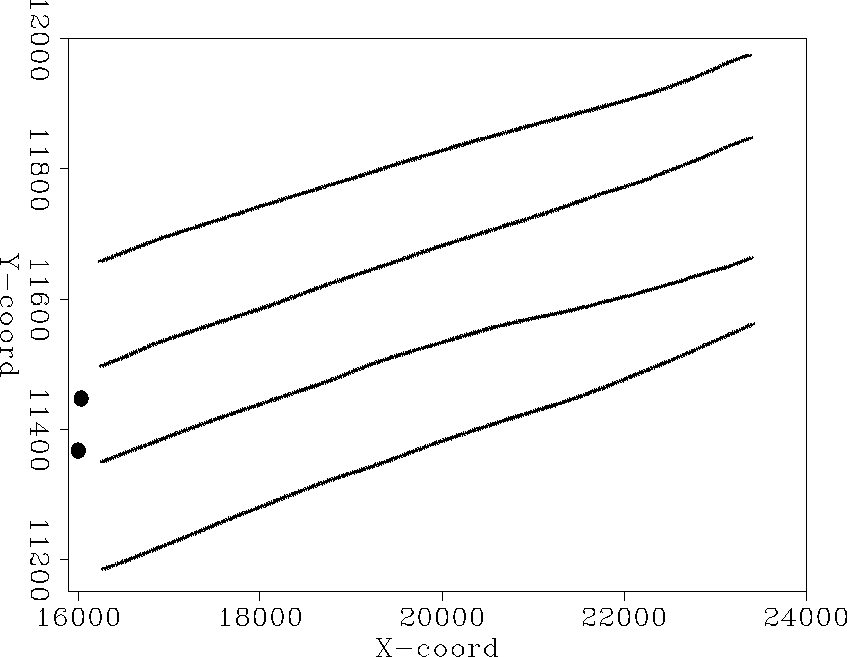
The strong currents present in the area caused significant feathering.
Figure ![[*]](http://sepwww.stanford.edu/latex2html/cross_ref_motif.gif) shows an example for the sail-line at cross-line distance
11440 m. For most shots,
the feathering was in the same South-North direction. Figure
shows an example for the sail-line at cross-line distance
11440 m. For most shots,
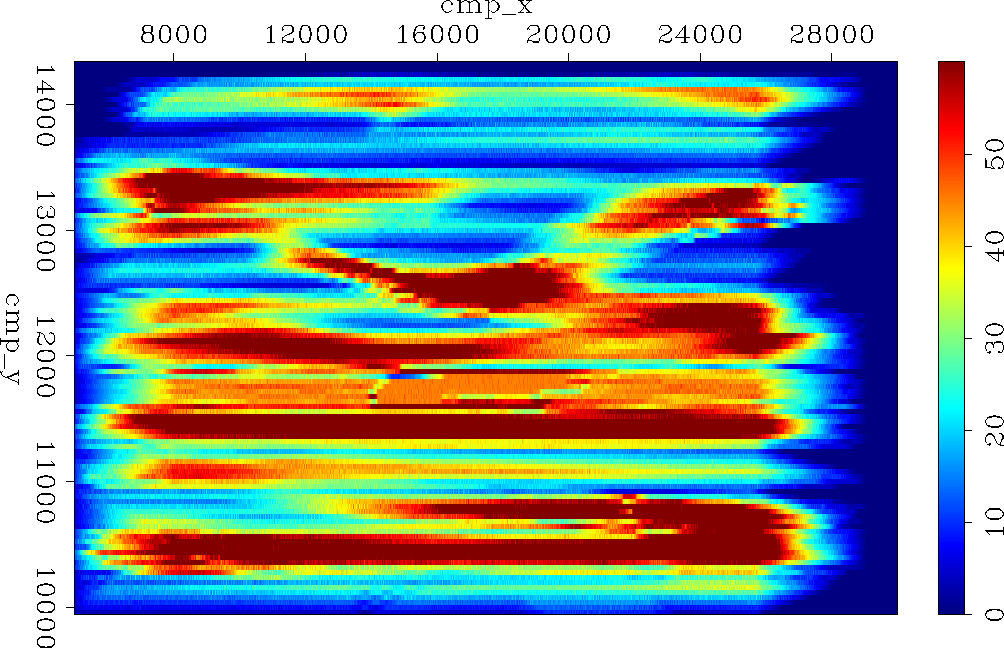
the feathering was in the same South-North direction. Figure ![[*]](http://sepwww.stanford.edu/latex2html/cross_ref_motif.gif) shows the
fold of coverage that in some places depart significantly from its design value of 48.
Some of the short source lines in Figure
shows the
fold of coverage that in some places depart significantly from its design value of 48.
Some of the short source lines in Figure ![[*]](http://sepwww.stanford.edu/latex2html/cross_ref_motif.gif) we acquired as infill to avoid
large coverage holes.
we acquired as infill to avoid
large coverage holes.
feathering
Figure 3 Map view of the receiver cables for one shot illustrating
typical feathering.


 fold
fold
Figure 4 Fold map illustrating relatively uniform coverage.


Next: Velocity model
Up: Description of the data
Previous: Description of the data
Stanford Exploration Project
5/6/2007

![[*]](http://sepwww.stanford.edu/latex2html/cross_ref_motif.gif) shows the acquisition template.
Figure
shows the acquisition template.
Figure ![[*]](http://sepwww.stanford.edu/latex2html/cross_ref_motif.gif) shows a map view of the subset of the shots used in this study.
Although most sail lines were straight in the East-West direction, a few had significant
curvature.
shows a map view of the subset of the shots used in this study.
Although most sail lines were straight in the East-West direction, a few had significant
curvature.


![[*]](http://sepwww.stanford.edu/latex2html/cross_ref_motif.gif) shows an example for the sail-line at cross-line distance
11440 m. For most shots,
the feathering was in the same South-North direction. Figure
shows an example for the sail-line at cross-line distance
11440 m. For most shots,
the feathering was in the same South-North direction. Figure ![[*]](http://sepwww.stanford.edu/latex2html/cross_ref_motif.gif) shows the
fold of coverage that in some places depart significantly from its design value of 48.
Some of the short source lines in Figure
shows the
fold of coverage that in some places depart significantly from its design value of 48.
Some of the short source lines in Figure ![[*]](http://sepwww.stanford.edu/latex2html/cross_ref_motif.gif) we acquired as infill to avoid
large coverage holes.
we acquired as infill to avoid
large coverage holes.

