![[*]](http://sepwww.stanford.edu/latex2html/cross_ref_motif.gif) shows an example of the character
of much of the data. The traces were balanced against each other, but
are otherwise raw recordings.
shows an example of the character
of much of the data. The traces were balanced against each other, but
are otherwise raw recordings.
Passive recordings were made available from 30 hours February 15,
2004, and 14 hours January 19, 2005. Of the former, some 7 hours was
lost due to a failed disk-drive. Of the 2500 4C stations, this work
uses the hydrophone measurement from each location. The data are
sampled at 0.004 ms, and recorded as contiguous files approximately 15
seconds long. Figure ![[*]](http://sepwww.stanford.edu/latex2html/cross_ref_motif.gif) shows an example of the character
of much of the data. The traces were balanced against each other, but
are otherwise raw recordings.
shows an example of the character
of much of the data. The traces were balanced against each other, but
are otherwise raw recordings.
 |
![[*]](http://sepwww.stanford.edu/latex2html/cross_ref_motif.gif) .
.
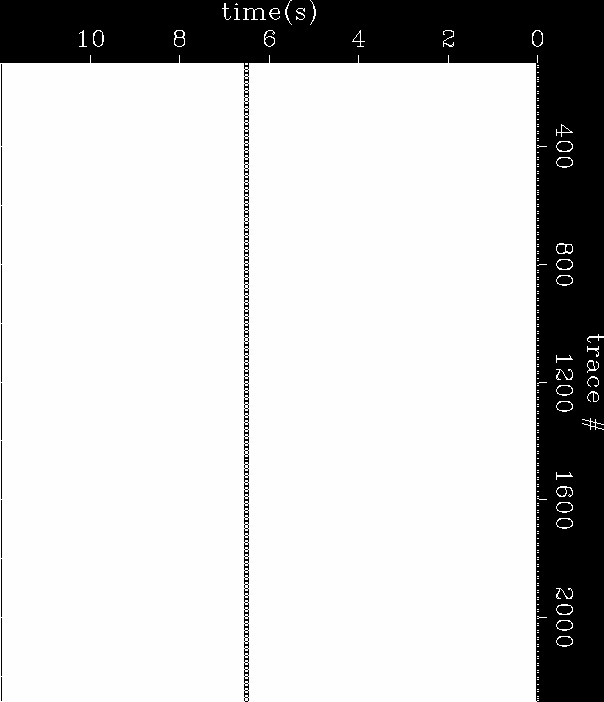
Figure ![[*]](http://sepwww.stanford.edu/latex2html/cross_ref_motif.gif) shows a conspicuous noise-train in a section of
raw data. While there are no coherent events, a noise-train about 7 seconds
long within the background chatter is reminiscent of the envelope of
a shot-gather. The minimum travel time of the noise-train is at trace
650. This trace is located at the end of the top half of the fourth
receiver line. The various jogs and cable terminations of this region
are associated with the surface facilities on location. Plotted over
the data are time picks modeled as a direct arrival from the location
of the platforms in the plane of the receivers. These were shifted to
align with the top and bottom of the noise train. The velocity used
to model this event is 1450 m/s. The fact that there is no velocity
increase for the bottom of the envelope suggests that this feature
does not contain reflections from the subsurface. Similar
examples of this type of noise-train are periodically recognizable
throughout data recordings. The source of the energy has a complex
coda and a finite duration.
shows a conspicuous noise-train in a section of
raw data. While there are no coherent events, a noise-train about 7 seconds
long within the background chatter is reminiscent of the envelope of
a shot-gather. The minimum travel time of the noise-train is at trace
650. This trace is located at the end of the top half of the fourth
receiver line. The various jogs and cable terminations of this region
are associated with the surface facilities on location. Plotted over
the data are time picks modeled as a direct arrival from the location
of the platforms in the plane of the receivers. These were shifted to
align with the top and bottom of the noise train. The velocity used
to model this event is 1450 m/s. The fact that there is no velocity
increase for the bottom of the envelope suggests that this feature
does not contain reflections from the subsurface. Similar
examples of this type of noise-train are periodically recognizable
throughout data recordings. The source of the energy has a complex
coda and a finite duration.
 |
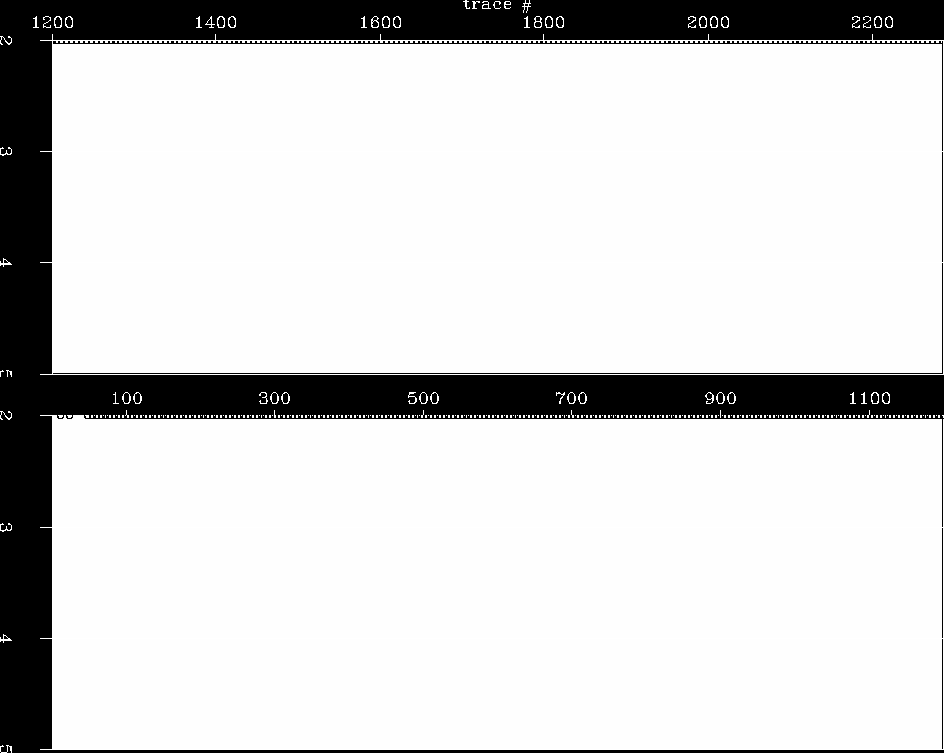
Figure ![[*]](http://sepwww.stanford.edu/latex2html/cross_ref_motif.gif) shows a short time window when a crisp series
of hyperbolic events is captured by the array. The top panel is the
Eastern half of the array and the bottom is the Western half. The
minimum travel-time of the hyperbolas decreases to the West of the top
panel in a similar fashion to the onset of the noise section in the
previous figure. This suggests that the production facilities are
again the source of the energy. The time picks overlaying the data in
Figure
shows a short time window when a crisp series
of hyperbolic events is captured by the array. The top panel is the
Eastern half of the array and the bottom is the Western half. The
minimum travel-time of the hyperbolas decreases to the West of the top
panel in a similar fashion to the onset of the noise section in the
previous figure. This suggests that the production facilities are
again the source of the energy. The time picks overlaying the data in
Figure ![[*]](http://sepwww.stanford.edu/latex2html/cross_ref_motif.gif) are the kinematics of a a co-planar direct arrival
from the 'O' in Figure
are the kinematics of a a co-planar direct arrival
from the 'O' in Figure ![[*]](http://sepwww.stanford.edu/latex2html/cross_ref_motif.gif) traveling at 1450 m/s. Every
third pick was plotted to avoid clutter. However, even when plotting
all picks in high resolution, the forward modeling clearly shows that
the data are aliased at this slowness value over the center of the
array where the event is not visible. Similar events are recognizable
throughout the records, though this is a particularly clear example.
traveling at 1450 m/s. Every
third pick was plotted to avoid clutter. However, even when plotting
all picks in high resolution, the forward modeling clearly shows that
the data are aliased at this slowness value over the center of the
array where the event is not visible. Similar events are recognizable
throughout the records, though this is a particularly clear example.
 |
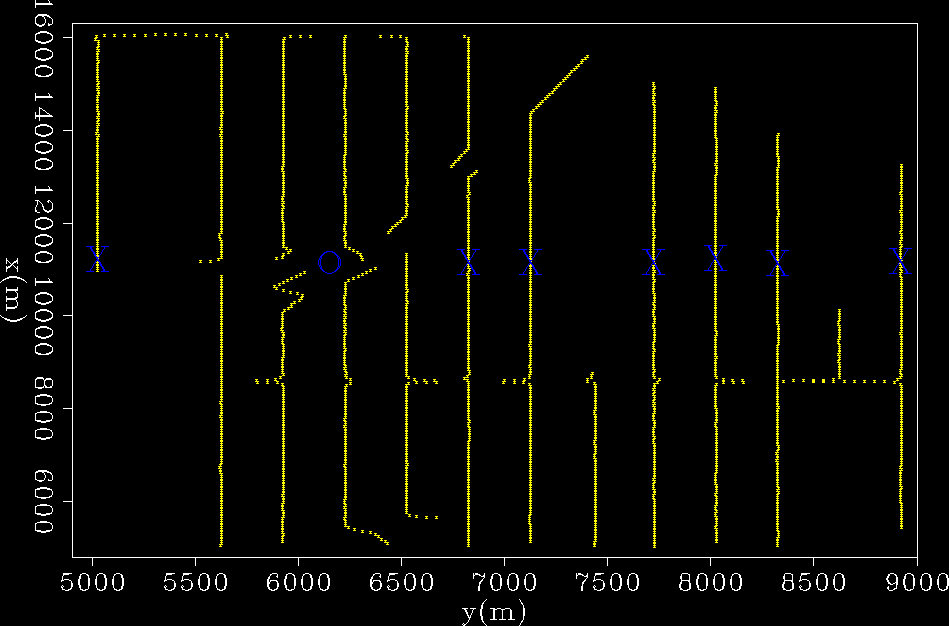
Figure ![[*]](http://sepwww.stanford.edu/latex2html/cross_ref_motif.gif) is a map of the array rotated to convenient
field coordinates. The 'X' symbols mark the locations
of the traces with minimum hyperbolic travel-times that were obvious
in the previous figures. The line containing the minimum travel-time
picks shows no inline offset variation and includes the area around
y=6250 m, which is the location of the platforms (presumably near the
'O' symbol). This figure provided the inline location for the picks
plotted in Figures
is a map of the array rotated to convenient
field coordinates. The 'X' symbols mark the locations
of the traces with minimum hyperbolic travel-times that were obvious
in the previous figures. The line containing the minimum travel-time
picks shows no inline offset variation and includes the area around
y=6250 m, which is the location of the platforms (presumably near the
'O' symbol). This figure provided the inline location for the picks
plotted in Figures ![[*]](http://sepwww.stanford.edu/latex2html/cross_ref_motif.gif) &
& ![[*]](http://sepwww.stanford.edu/latex2html/cross_ref_motif.gif) . The crossline
coordinate was deduced by matching the picks to the various
observations.
. The crossline
coordinate was deduced by matching the picks to the various
observations.
|
minloc
Figure 6 Receiver array in field coordinates. Marked with 'X' are the locations of traces with minimum travel-times picked from the hyperbolas in Figure ![[*]](http://sepwww.stanford.edu/latex2html/cross_ref_motif.gif) . Even though the event is not clear on the
central lines of the array, the line connecting the traces where it
is visible intersects the location of the surface facilities. . Even though the event is not clear on the
central lines of the array, the line connecting the traces where it
is visible intersects the location of the surface facilities.
|  |