

Next: Conclusion
Up: Tang and Clapp: Lloyd's
Previous: selecting reference anisotropic parameters
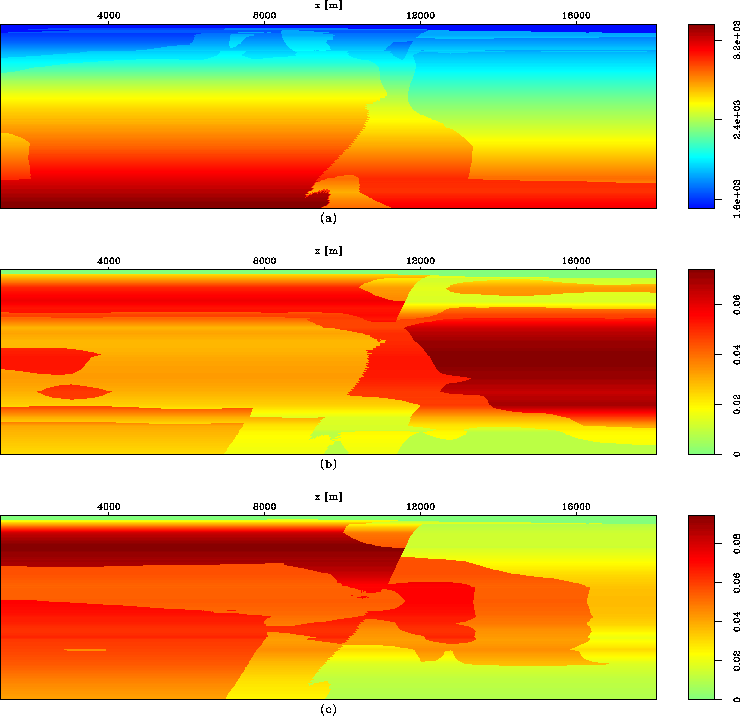
To compare the migration results we uniformly select three vs,
 s and
s and  s separately for the conventional method;
the chosen reference parameters are shown in Figure
 ![[*]](http://sepwww.stanford.edu/latex2html/cross_ref_motif.gif) .
For the modified 3D Lloyd's method, we also start with three vs, three
.
For the modified 3D Lloyd's method, we also start with three vs, three  s and
three
  s as the initial input and we set the maximum
number of anisotropic parameters equal to 27 for each depth level. This
guarantees that the number of parameters selected by the modified 3D Lloyd's algorithm
will be no larger than that obtained by uniform sampling.
In this case, the total number of depth levels is nz=410; hence, for a uniform sampling of reference parameters,
we must perform
  wavefield extrapolations.
After selecting by the modified Lloyd's algorithm, however,
the total number of extrapolations reduces to 4952, reducing the computation time by about
  .Figure
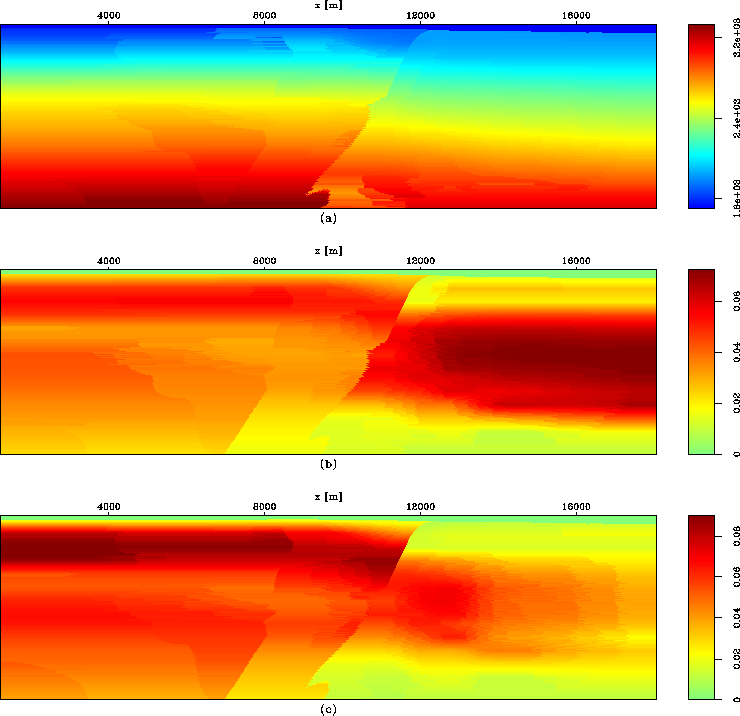
 ![[*]](http://sepwww.stanford.edu/latex2html/cross_ref_motif.gif) illustrates the reference parameters selected by the modified 3D Lloyd's algorithm.
It is clear
in Figure
illustrates the reference parameters selected by the modified 3D Lloyd's algorithm.
It is clear
in Figure ![[*]](http://sepwww.stanford.edu/latex2html/cross_ref_motif.gif) that Lloyd's algorithm has done a very good job of describing the actual model.
Figures
that Lloyd's algorithm has done a very good job of describing the actual model.
Figures ![[*]](http://sepwww.stanford.edu/latex2html/cross_ref_motif.gif) -
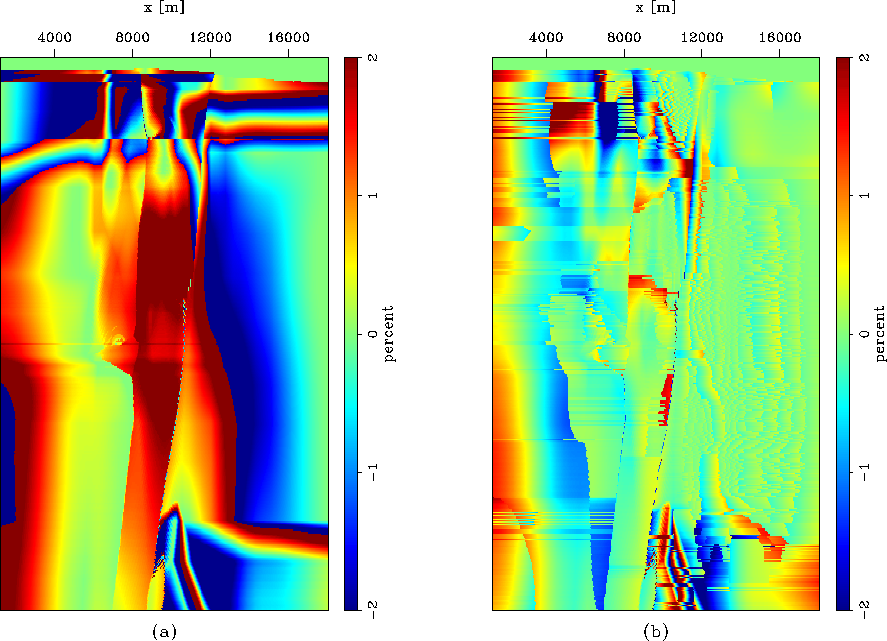
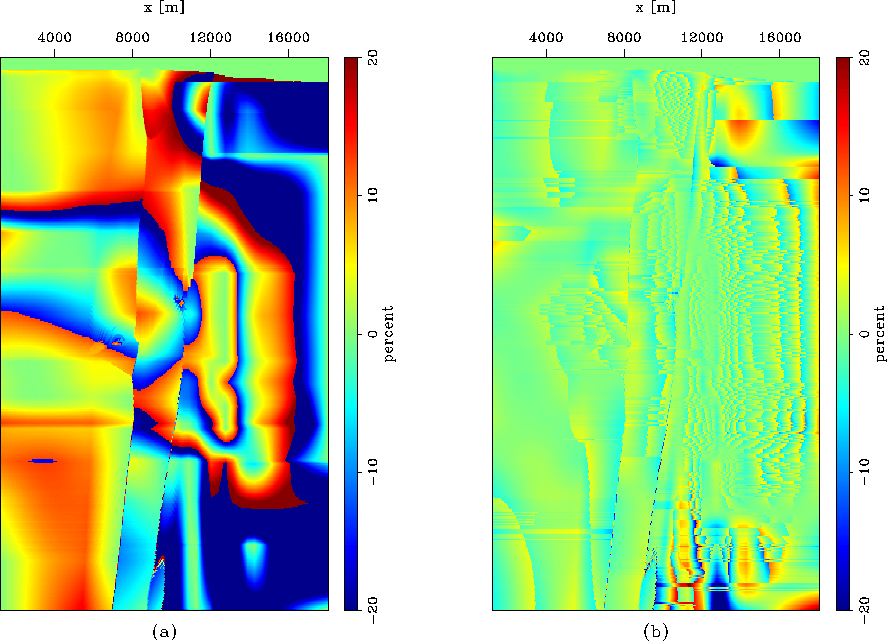
-![[*]](http://sepwww.stanford.edu/latex2html/cross_ref_motif.gif) show the error maps between the actual model
and the selected reference parameters both by the conventional method
and the modified 3D Lloyd's method. Obviously, using Lloyd's method, we obtain much smaller differences
between the actual model and the reference parameters.
show the error maps between the actual model
and the selected reference parameters both by the conventional method
and the modified 3D Lloyd's method. Obviously, using Lloyd's method, we obtain much smaller differences
between the actual model and the reference parameters.
para_uniform
Figure 4 Selection of anisotropic parameters by uniform sampling
(the vertical axes are depths).
(a) Reference velocity; (b) reference  ; (c) reference
  .
.


 para_lloyd
Figure 5 Selection of anisotropic parameters by the modified 3D Lloyd's algorithm
(the vertical axes are depths).
(a) Reference velocity; (b) reference  ; (c) reference
  .
.


 error_pv
Figure 6 Error map between the actual velocities and the reference velocities
(the vertical axes are depths).
Both maps are shown in the same scale (percentage). (a) By conventional method; (b) by Lloyd's algorithm.


 error_delta
Figure 7 Error map between the actual  and the reference
  (the vertical axes are depths).
Both maps are shown in the same scale (percentage). (a) By conventional method; (b) by Lloyd's algorithm.


 error_eta
Figure 8 Error map between the actual  and the reference
  (the vertical axes are depths).
Both maps are shown in the same scale (percentage). (a) By conventional method; (b) by Lloyd's algorithm.


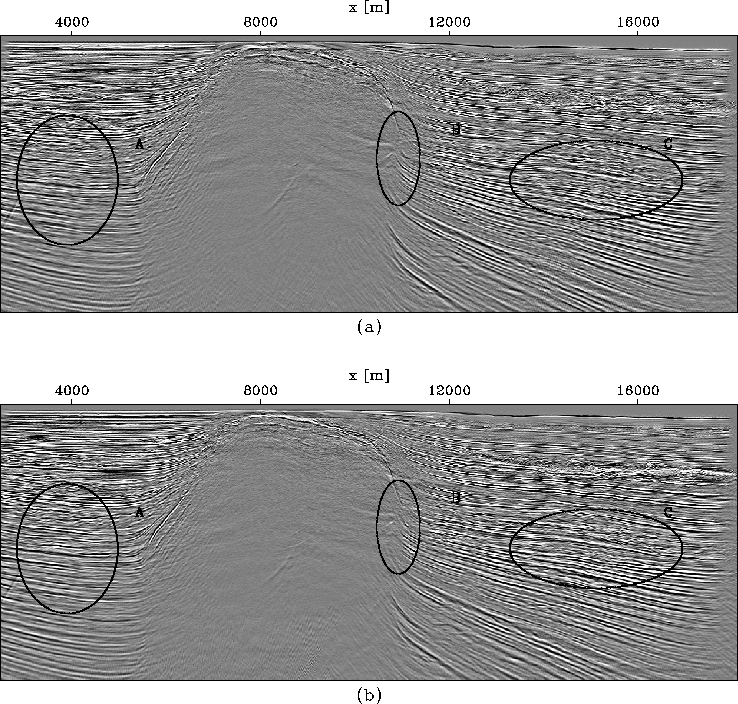
Figure ![[*]](http://sepwww.stanford.edu/latex2html/cross_ref_motif.gif) (a) shows the anisotropic prestack migration result of the conventional approach, while
Figure
(a) shows the anisotropic prestack migration result of the conventional approach, while
Figure ![[*]](http://sepwww.stanford.edu/latex2html/cross_ref_motif.gif) (b) shows the result of using the modified 3D Lloyd's algorithm for
reference-parameter selections. Though in both cases, all reflectors are nicely imaged, we can
still identify the differences between Figure
(b) shows the result of using the modified 3D Lloyd's algorithm for
reference-parameter selections. Though in both cases, all reflectors are nicely imaged, we can
still identify the differences between Figure ![[*]](http://sepwww.stanford.edu/latex2html/cross_ref_motif.gif) (a) and
(a) and ![[*]](http://sepwww.stanford.edu/latex2html/cross_ref_motif.gif) (b).
Using the modified 3D Lloyd's algorithm yields a more focused
and continuous salt flank (portion B);
the layers, especially A and C, have stronger amplitudes and are better imaged.
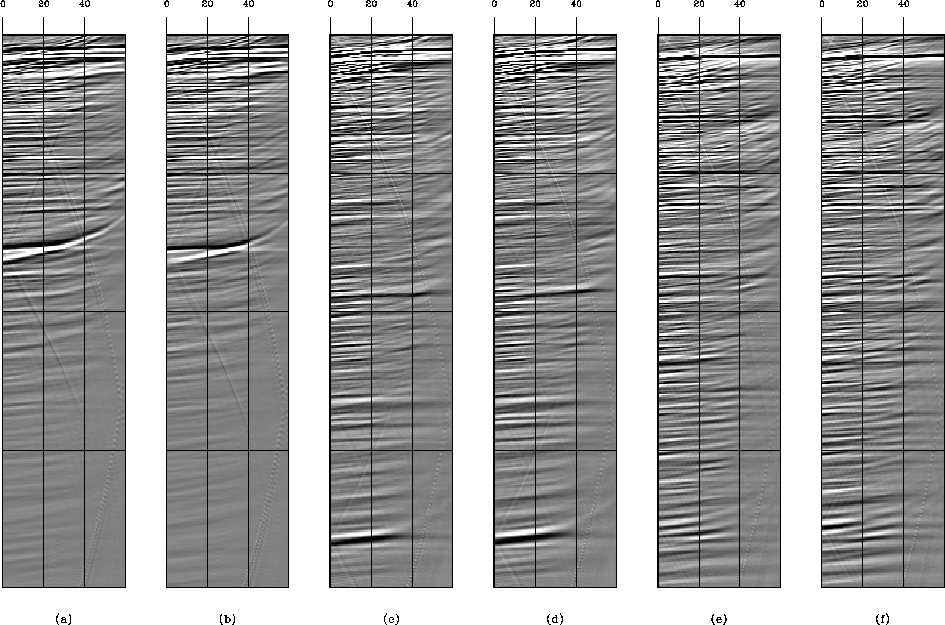
The angle-domain common image gathers (ADCIGs) for different surface locations
computed from images obtained by using both methods are illustrated next to each other in Figure
(b).
Using the modified 3D Lloyd's algorithm yields a more focused
and continuous salt flank (portion B);
the layers, especially A and C, have stronger amplitudes and are better imaged.
The angle-domain common image gathers (ADCIGs) for different surface locations
computed from images obtained by using both methods are illustrated next to each other in Figure ![[*]](http://sepwww.stanford.edu/latex2html/cross_ref_motif.gif) .
Figures
.
Figures ![[*]](http://sepwww.stanford.edu/latex2html/cross_ref_motif.gif) (a),
(a), ![[*]](http://sepwww.stanford.edu/latex2html/cross_ref_motif.gif) (c) and
(c) and ![[*]](http://sepwww.stanford.edu/latex2html/cross_ref_motif.gif) (e) are the ADCIGs computed
from the image obtained by using the uniform sampling method (Figure
(e) are the ADCIGs computed
from the image obtained by using the uniform sampling method (Figure ![[*]](http://sepwww.stanford.edu/latex2html/cross_ref_motif.gif) (a)) at surface location
x=5,875 meters, 11,375 meters and 13,875 meters respectively,
while Figures
(a)) at surface location
x=5,875 meters, 11,375 meters and 13,875 meters respectively,
while Figures ![[*]](http://sepwww.stanford.edu/latex2html/cross_ref_motif.gif) (b),
(b), ![[*]](http://sepwww.stanford.edu/latex2html/cross_ref_motif.gif) (d) and
(d) and ![[*]](http://sepwww.stanford.edu/latex2html/cross_ref_motif.gif) (f) are the
corresponding ADCIGs
from the image obtained by using the modified Lloyd's algorithm (Figure
(f) are the
corresponding ADCIGs
from the image obtained by using the modified Lloyd's algorithm (Figure ![[*]](http://sepwww.stanford.edu/latex2html/cross_ref_motif.gif) (b))
at surface location x=5,875 meters, 11,375 meters and 13,875 meters respectively. The differences between the
ADCIGs computed from Figure
(b))
at surface location x=5,875 meters, 11,375 meters and 13,875 meters respectively. The differences between the
ADCIGs computed from Figure ![[*]](http://sepwww.stanford.edu/latex2html/cross_ref_motif.gif) (a) and those computed from Figure
(a) and those computed from Figure ![[*]](http://sepwww.stanford.edu/latex2html/cross_ref_motif.gif) (b)
are minor, but we can still see that the ADCIGs shown in Figures
(b)
are minor, but we can still see that the ADCIGs shown in Figures ![[*]](http://sepwww.stanford.edu/latex2html/cross_ref_motif.gif) (b),
(b),
![[*]](http://sepwww.stanford.edu/latex2html/cross_ref_motif.gif) (d) and
(d) and ![[*]](http://sepwww.stanford.edu/latex2html/cross_ref_motif.gif) (f) are generally
more flat and continuous than those illustrated in Figures
(f) are generally
more flat and continuous than those illustrated in Figures ![[*]](http://sepwww.stanford.edu/latex2html/cross_ref_motif.gif) (a),
(a),
![[*]](http://sepwww.stanford.edu/latex2html/cross_ref_motif.gif) (c) and
(c) and ![[*]](http://sepwww.stanford.edu/latex2html/cross_ref_motif.gif) (e), which indicates
that the reference anisotropic parameters selected by the modified 3D Lloyd's algorithm are
more accurate than those selected by the uniform sampling method. One thing needed for an extra emphasis
is that the computational cost by using Lloyd's algorithm is
only half of that by using the conventional method.
(e), which indicates
that the reference anisotropic parameters selected by the modified 3D Lloyd's algorithm are
more accurate than those selected by the uniform sampling method. One thing needed for an extra emphasis
is that the computational cost by using Lloyd's algorithm is
only half of that by using the conventional method.
animig
Figure 9 Anisotropic prestack migration result (the vertical axes are depths).
(a) Reference parameters selected by the conventional method;
(b) reference parameters selected by the modified 3D Lloyd's algorithm.
The computational cost for (b) is only half of that for (a)


 anglegather
Figure 10 ADCIGs for different surface locations
(the vertical axes are depths, while the horizontal axes are angles).
(a), (c) and (e) are ADCIGs computed from the migration result obtained by
using uniform sampling at horizontal locations x=5,875 meters, 11,375 meters and 13,875 meters respectively,
while (b), (d) and (f) are ADCIGs computed from the migration result obtained by
using the modified 3D lloyd's algorithm at horizontal locations x=5875 meters,
11,375 meters and 13,875 meters respectively.


Next: Conclusion
Up: Tang and Clapp: Lloyd's
Previous: selecting reference anisotropic parameters
Stanford Exploration Project
4/5/2006
![[*]](http://sepwww.stanford.edu/latex2html/cross_ref_motif.gif) .
For the modified 3D Lloyd's method, we also start with three vs, three
.
For the modified 3D Lloyd's method, we also start with three vs, three ![[*]](http://sepwww.stanford.edu/latex2html/cross_ref_motif.gif) illustrates the reference parameters selected by the modified 3D Lloyd's algorithm.
It is clear
in Figure
illustrates the reference parameters selected by the modified 3D Lloyd's algorithm.
It is clear
in Figure ![[*]](http://sepwww.stanford.edu/latex2html/cross_ref_motif.gif) that Lloyd's algorithm has done a very good job of describing the actual model.
Figures
that Lloyd's algorithm has done a very good job of describing the actual model.
Figures ![[*]](http://sepwww.stanford.edu/latex2html/cross_ref_motif.gif) -
-![[*]](http://sepwww.stanford.edu/latex2html/cross_ref_motif.gif) show the error maps between the actual model
and the selected reference parameters both by the conventional method
and the modified 3D Lloyd's method. Obviously, using Lloyd's method, we obtain much smaller differences
between the actual model and the reference parameters.
show the error maps between the actual model
and the selected reference parameters both by the conventional method
and the modified 3D Lloyd's method. Obviously, using Lloyd's method, we obtain much smaller differences
between the actual model and the reference parameters.
