Next: Anisotropic residual moveout for
Up: Kinematic analysis of ADCIGs
Previous: Analytical evaluation of the
The analytical kinematic results can be verified by
numerical computations of impulse responses
by wavefield migration and transformation of the resulting
prestack image cubes
into the angle domain.
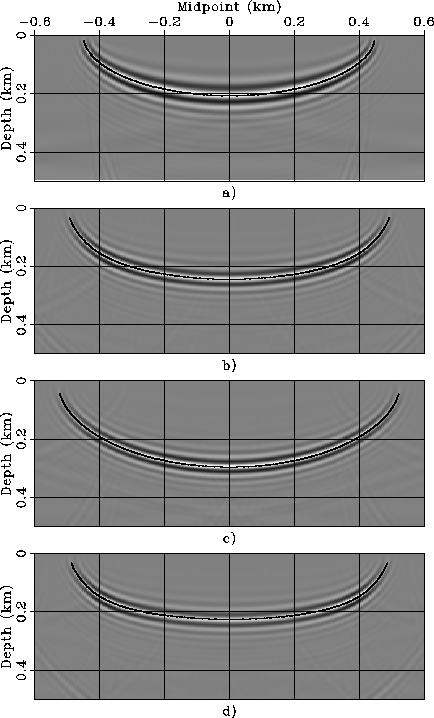
Figure ![[*]](http://sepwww.stanford.edu/latex2html/cross_ref_motif.gif) shows
four zero subsurface-offset sections cut through
the impulse responses computed by
wavefield-continuation anisotropic migration
for the three anisotropic rocks described in the table
on page and for an isotropic rock.
The parameters defining the impulse responses
are the same as for Figure ;
that is, tD=.9 seconds, mD=0 kilometers,
and hD=.4 kilometers, and vertical slowness SV=1 s/km.
Figure a shows the isotropic case,
Figure b shows the Taylor Sand case,
Figure c shows the Mesa Clay Shale case,
and
Figure d shows the GreenLight River Shale case.
As in Figure ,
the line superimposed onto the images represent the
impulse response computed using the kinematic expressions
in equations 18-24.
The kinematic curves perfectly predicts the shape of the images
even for very steep dips.
shows
four zero subsurface-offset sections cut through
the impulse responses computed by
wavefield-continuation anisotropic migration
for the three anisotropic rocks described in the table
on page and for an isotropic rock.
The parameters defining the impulse responses
are the same as for Figure ;
that is, tD=.9 seconds, mD=0 kilometers,
and hD=.4 kilometers, and vertical slowness SV=1 s/km.
Figure a shows the isotropic case,
Figure b shows the Taylor Sand case,
Figure c shows the Mesa Clay Shale case,
and
Figure d shows the GreenLight River Shale case.
As in Figure ,
the line superimposed onto the images represent the
impulse response computed using the kinematic expressions
in equations 18-24.
The kinematic curves perfectly predicts the shape of the images
even for very steep dips.
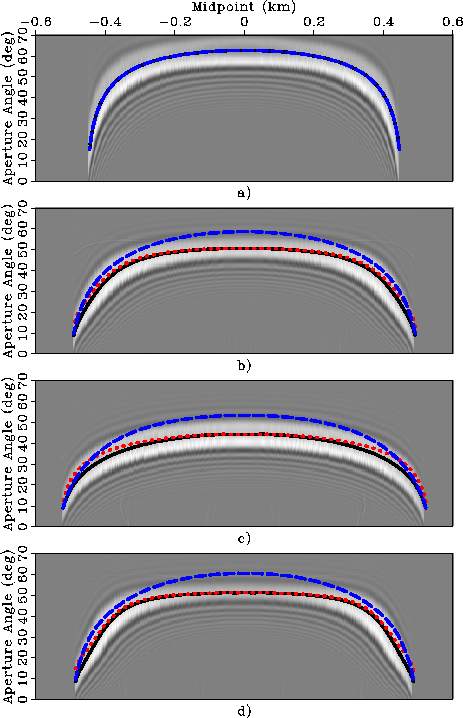
Figure
shows two-dimensional slices cut through the cube obtained by
the transformation to the angle domain of the impulse responses
shown in Figure .
The slices are cut at the midpoint and depth corresponding
to the expected location of the impulse responses;
that is, at the location tracked by the lines shown
in Figure .
There are three lines superimposed onto the angle-domain images.
The solid lines display the numerical computation
of  by applying equation 25.
They perfectly track, as expected,
the results of the transformation of the prestack images
to angle domain.
The dotted lines display the phase aperture angle
by applying equation 25.
They perfectly track, as expected,
the results of the transformation of the prestack images
to angle domain.
The dotted lines display the phase aperture angle  .As expected, they overlap with the solid line around
the zero midpoint (i.e. flat reflector),
and depart from them at larger midpoints,
which correspond to steeper reflections.
However, the error introduced by ignoring
the difference between
and is small,
and likely to be negligible in most practical situations.
Finally, the dashed lines display the
group aperture angle
.As expected, they overlap with the solid line around
the zero midpoint (i.e. flat reflector),
and depart from them at larger midpoints,
which correspond to steeper reflections.
However, the error introduced by ignoring
the difference between
and is small,
and likely to be negligible in most practical situations.
Finally, the dashed lines display the
group aperture angle  .The differences between and are substantial,
up to 20% in some cases.
Ignoring them might
be detrimental to the application of ADCIGs.
Notice that in the isotropic case the three lines
perfectly overlap and all of them match the image.
.The differences between and are substantial,
up to 20% in some cases.
Ignoring them might
be detrimental to the application of ADCIGs.
Notice that in the isotropic case the three lines
perfectly overlap and all of them match the image.
Quad_hxd_.4-overn
Figure 5
Impulse responses evaluated at zero subsurface offset for four
rock types:
a) Isotropic, b) Taylor Sand, c) Mesa Clay Shale,
and
d) GreenLight River Shale.
Superimposed onto the images are the impulse responses computed by
the kinematic expressions presented in
equations 18-24.


Quad_Mx-Ang_hxd_.4-overn
Figure 6
Slices of the impulse responses transformed into the angle-domain
for four rock types:
a) Isotropic, b) Taylor Sand, c) Mesa Clay Shale,
and
d) GreenLight River Shale.
Superimposed onto the images there are the curves
computed by applying the kinematic analysis:
(dashed line),
(dotted line),
and
(solid line).
Next: Anisotropic residual moveout for
Up: Kinematic analysis of ADCIGs
Previous: Analytical evaluation of the
Stanford Exploration Project
5/3/2005