

Next: Conclusions
Up: FEAVA in the image
Previous: In the absence of
High contrasts between layers in the velocity model cause a very large number
of multiples to be generated.
The result of migrating this multiple-affected dataset with the
background trend from the left panel of Figure ![[*]](http://sepwww.stanford.edu/latex2html/cross_ref_motif.gif) is
shown in the upper panels of Figure
is
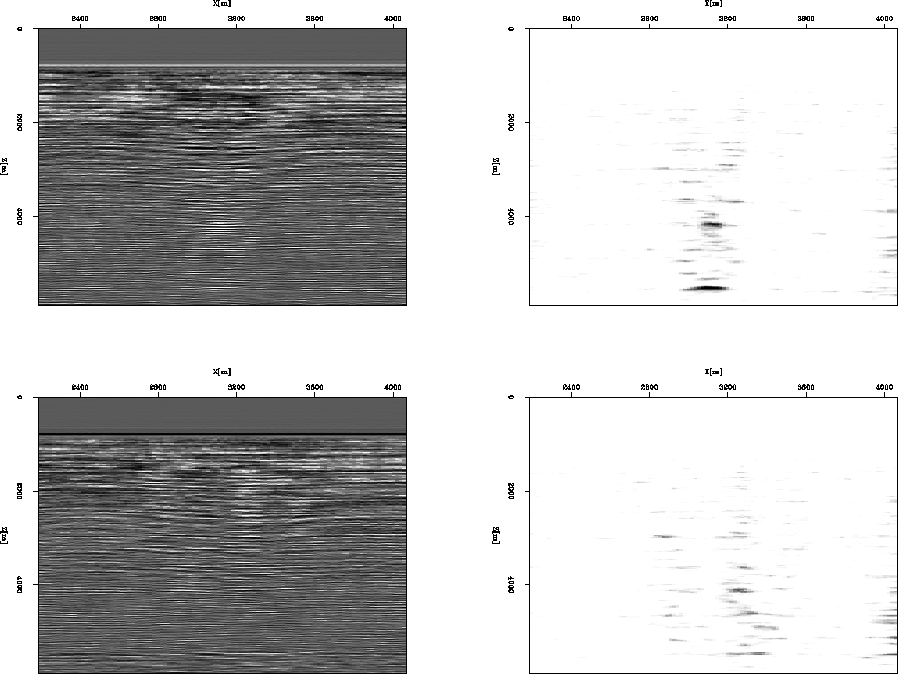
shown in the upper panels of Figure ![[*]](http://sepwww.stanford.edu/latex2html/cross_ref_motif.gif) . FEAVA is
indicated by a vertical path of high energy in the middle of the image
and is clearly outlined by the FEAVA detector. Non-focused multiples
depart from Shuey's approximation too, but the resulting
FEAVA detector output is one order of magnitude smaller than that
caused by actual focusing. The lower panels of Figure
. FEAVA is
indicated by a vertical path of high energy in the middle of the image
and is clearly outlined by the FEAVA detector. Non-focused multiples
depart from Shuey's approximation too, but the resulting
FEAVA detector output is one order of magnitude smaller than that
caused by actual focusing. The lower panels of Figure
![[*]](http://sepwww.stanford.edu/latex2html/cross_ref_motif.gif) show the results of migrating with the correct
velocity model, albeit with a single reference velocity. The focusing
is no longer visible in the image. The
focusing-caused FEAVA detector output has fallen significantly, to the
level of power of surrounding multiples. The two FEAVA outputs
are displayed in the same intensity scale.
bg-refvel1
show the results of migrating with the correct
velocity model, albeit with a single reference velocity. The focusing
is no longer visible in the image. The
focusing-caused FEAVA detector output has fallen significantly, to the
level of power of surrounding multiples. The two FEAVA outputs
are displayed in the same intensity scale.
bg-refvel1
Figure 5 Top-left: image produced
with the linear background velocity trend; Top-right: output
of FEAVA detection applied after linear
background velocity migration; Bottom-left: image produced
with the correct velocity (split-step kernel with one reference velocity);
Bottom-right: output of FEAVA detection applied after split-step
migration with the correct model, one reference velocity. FEAVA
detector outputs in the same color scale, for comparison.


 refvel8-infill
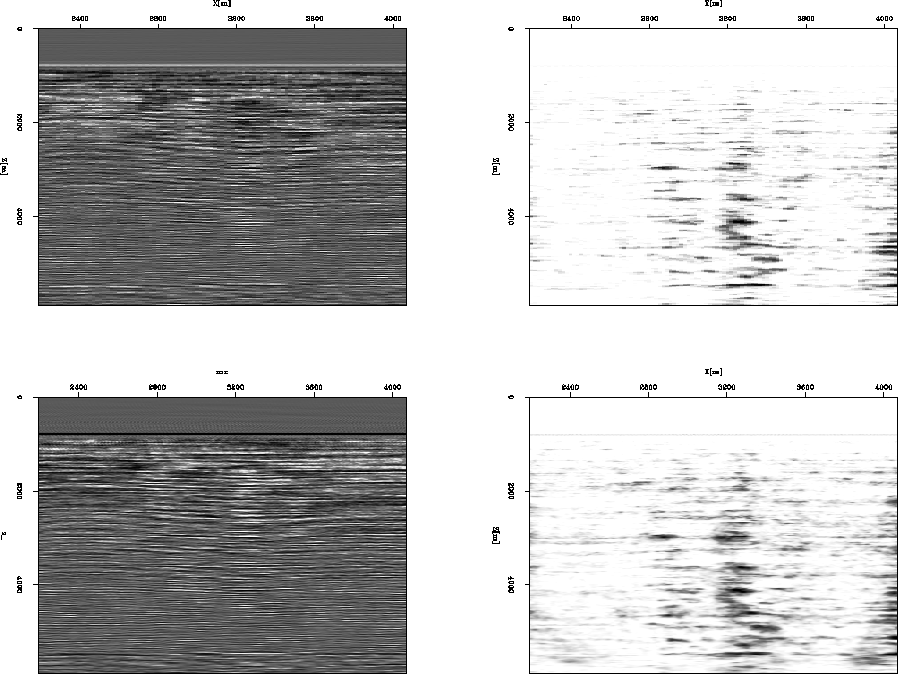
Figure 6 Top-left: image produced
with the correct velocity (split-step kernel, eight reference velocities); Top-right: output
of FEAVA detection applied after migration with the correct velocity
(eight reference velocities); Bottom-left: image produced
with the correct velocity (split-step kernel with one reference velocity) on
dense data;
Bottom-right: output of FEAVA detection applied after split-step
migration with the correct model, one reference velocity on dense
data. For detail enhancement, FEAVA detector outputs are not in the same color scale.


FEAVA was clearly reduced by migration, but not entirely
eliminated. One natural question is whether significantly increasing
the number of reference velocities in migration will improve the
outcome. However, a migration with eight reference velocities which
produced the upper panels of Figure ![[*]](http://sepwww.stanford.edu/latex2html/cross_ref_motif.gif) , show
that this is not the case for this type of stratigraphic play. The improvements are
incremental, visible only by electronically displaying the two pictures in an
animated sequence.
, show
that this is not the case for this type of stratigraphic play. The improvements are
incremental, visible only by electronically displaying the two pictures in an
animated sequence.
Another potential limitation
stems from the fact that, due to the combination of depth/offset sampling Sava and Biondi (2001), the range of angles into
which offsets can be reliably transformed was limited to
 , while the FEAVO detector works up to
  . Would
energy from greater angles improve the situation? The bottom panels of
Figure
 ![[*]](http://sepwww.stanford.edu/latex2html/cross_ref_motif.gif) are produced with an offset sampling
four times smaller than before, resulting in reliable transformations
from offset to angle up to
are produced with an offset sampling
four times smaller than before, resulting in reliable transformations
from offset to angle up to  . This does not bring
improvements either. On the contrary, multiples, highly curved at
large angles, create more noise in the FEAVA detector
output. The extra smoothness comes from having decreased the midpoint
sampling by a factor of four.


Next: Conclusions
Up: FEAVA in the image
Previous: In the absence of
Stanford Exploration Project
10/23/2004

![[*]](http://sepwww.stanford.edu/latex2html/cross_ref_motif.gif) is
shown in the upper panels of Figure
is
shown in the upper panels of Figure 