Next: REFERENCES
Up: Ji: Automatic discontinuity extraction
Previous: Locating regions for potential
The binary image obtained in the previous section
represents the shape of the region
where the discontinuity surfaces may exist.
Therefore, the discontinuity location could be found by thinning the 3D binary image.
There are various thinning algorithms developed in the image processing field
and they have been used for various applications in topological analysis.
I used a 2D thinning algorithm and adapted it into 3D image skeletonization.
The conventional 2D thinning algorithm can be explained as follows:
for a given pixel location whose value is 1, its value will be changed to 0
if the neighboring pixels have values like one of the patterns shown in
equation (4). This operation continues until no pixels change.
It will leave thin lines a pixel in width.
The structure elements used in 2D thinning are given as follows:
| ![\begin{displaymath}
{\bf L_1}=
\left[
\begin{array}
{ccc}
0&0&0\\ *&1&*\\ 1&1&1\...
...rray}
{ccc}
*&0&0\\ 1&1&0\\ *&1&*\\ \end{array}\right],
\dots .\end{displaymath}](img6.gif) |
(4) |
where the central location ``1'' corresponds to the pixel for operation
and ``*'' corresponds to unused pixels. The rest of the 6 elements can be found by
rotating the above element appropriately Sonka et al. (1999).
Direct extending this 2D algorithm into a 3D algorithm,
will result in a 3D thinning algorithm
that produces 3D lines Ma and Sonka (1996).
Such line searching does not meet our goal of finding 3D surfaces
by squeezing a 3D region.
Therefore, I iteratively applied the 2D thinning algorithms
for each orthogonal direction, resulting in the desired 3D thinning algorithm.
First, the 2D thinning algorithm is applied once
for each (x,y), (y,z), and (x,z)
plane separately, and the pixel is considered to be removed
only if the removal happens in at least two of the three planes.
The thinning continues until no pixels change.
Finally, this results in 3D surfaces with a width of one pixel,
representing the locations of discontinuities.
This process can be summarized in a pseudo code as follows:
 old_data(x,y,z) = binary_data(x,y,z)
 condition = 1
 do while (condition .eq. 1)
 {
 temp1(x,y,z) = 2D thinning along every (x,y) plane on old_data(x,y,z)
 temp2(x,y,z) = 2D thinning along every (y,z) plane on old_data(x,y,z)
 temp3(x,y,z) = 2D thinning along every (x,z) plane on old_data(x,y,z)
 new_data = [(temp1.and.temp2).or.(temp2.and.temp3).or.(temp1.and.temp3)]
 if(new_data .eq. old_data) { condition = 0 }
 else	                    { old_data(x,y,z) = new_data(x,y,z) }
 }
The above 3D thinning algorithm is applied
to the three differently thresholded images
shown in Figure 9, Figure 10, and Figure 11.
The results are shown
at Figure 12, Figure 13, and Figure 14, respectively.
These figures show that as the thresholding value increases,
more detailed shapes of the discontinuities can be found without
affecting the major structure of the discontinuity surfaces.
This reveals the robustness of the method in choosing the threshold values.
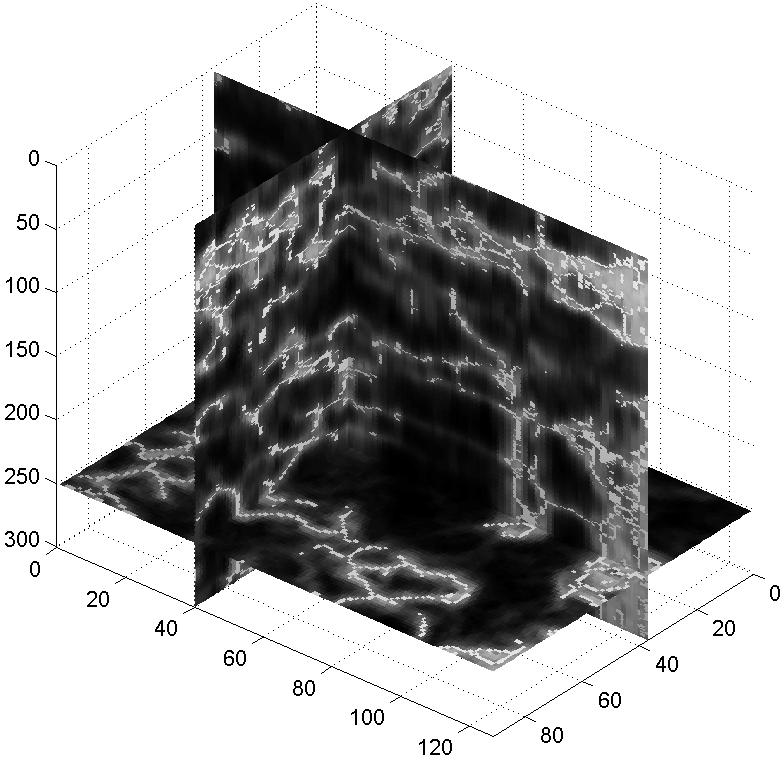
By overlapping the discontinuity map onto the original coherency cube,
we can see that the locations of discontinuities
are accurately positioned, as expected (Figure 15).
thin20
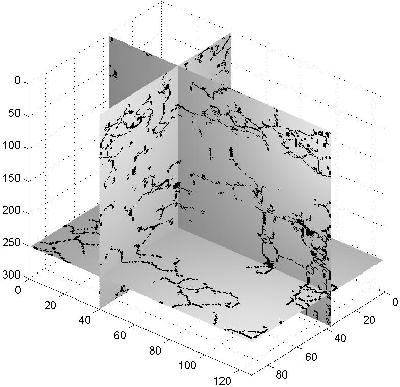
Figure 12 Discontinuity surfaces found by thinning the binary image with thresholding value of 0.2.
 thin30
Figure 13 Discontinuity surfaces found by thinning the binary image with thresholding value of 0.3.
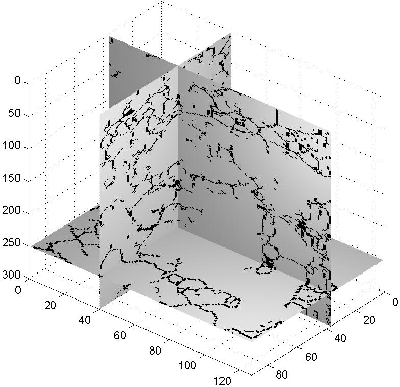
thin40
Figure 14 Discontinuity surfaces found by thinning the binary image with thresholding value of 0.4.
thincoh30
Figure 15 Discontinuities with thresholding value od 0.3 are overlapped with coherency cube to examine the accuracy of the location. To visualize the location of the discontinuites, low values in the coherency cube are expressed in bright grey and high values are expressed in dark grey.
I describe an automatic algorithm for discontinuity extraction
from a 3D seismic image cube.
The proposed algorithm consists of three steps.
The first step is the coherency computation which results in
a coherency cube that gives event semblance at each point.
Then next step is to represent the potential discontinuity locations
in binary image form.
This is accomplished by thresholding the histogram-equalized coherency cube.
The final step is finding location of the discontinuity by thinning
the binary image obtained in the previous step.
For thinning in the 3D sense, a 2D thinning algorithm is consecutively
applied to produce an arbitrary shaped 3D surface.
Testing the algorithm on a real seismic image
demonstrated that it can successfully
find discontinuity surfaces.
The extracted discontinuity surfaces could be interpreted
as fault, unconformity, or buried channel.
However, in order to make the proposed algorithm a more useful tool
that produces geologically meaningful surfaces,
further research needs to be followed.
Two areas of research are:
(1) The development of topological relationships
between surfaces to determine whether they are connected on not.
and (2) The inclusion of smoothness criteria,
as geology may often dictate that some discontinuity surfaces
are expected to be smooth.
Next: REFERENCES
Up: Ji: Automatic discontinuity extraction
Previous: Locating regions for potential
Stanford Exploration Project
10/14/2003