Next: Conclusion
Up: Experiments
Previous: Synthetic problems
Two field data CMP's are also analyzed with the BP algorithm. With an
order of magnitude increase in size, as well as much energy in the
data that leads to a more full model space, convergence does not seem
as well behaved for real data.
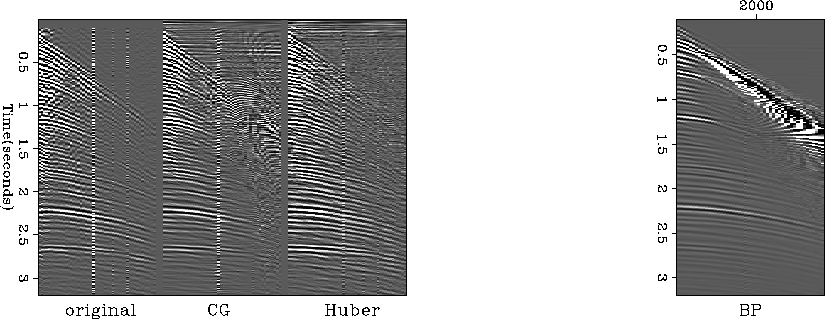
For the CMP with bad traces in Figure ![[*]](http://sepwww.stanford.edu/latex2html/cross_ref_motif.gif) ,
we needed only 10 minutes of CPU time.
Normally, this computation requires user intervention to stop the
process as it looked to become unstable.
The multiple ridden data of Figure
, however, required about 40 minutes to compute. The
model space used in both examples was only
approximately 2.5-fold overcomplete, and this fact may contribute to
the problems experienced. Interestingly, with the regularization
parameter
,
we needed only 10 minutes of CPU time.
Normally, this computation requires user intervention to stop the
process as it looked to become unstable.
The multiple ridden data of Figure
, however, required about 40 minutes to compute. The
model space used in both examples was only
approximately 2.5-fold overcomplete, and this fact may contribute to
the problems experienced. Interestingly, with the regularization
parameter  , the algorithm has a drastic denoising effect as
well.
, the algorithm has a drastic denoising effect as
well.
Figure compares the predicted data from CG least
squares inversion, the Huber norm inversion, and the BP inversion. The
noise reduction of the near traces is remarkable and deserves further
research. A very powerful linear noise train bounds the data to the
right, which we hypothesize is the result of the near offset noise in
the raw data. Figure contains four powerful noisy
traces between 2200 - 2700 m/s. Also noticeable is the tendency for
the forward model to bifurcate real events into a correct and a fast
event such as at 1.25 seconds. Replacing the high amplitude ringing
trace with zeros did not fix the problem.
badtr
Figure 4 Modeled data after
inversion compared to original a CMP that suffers from bad traces
and substantial near offset noise.
 vel-badtr
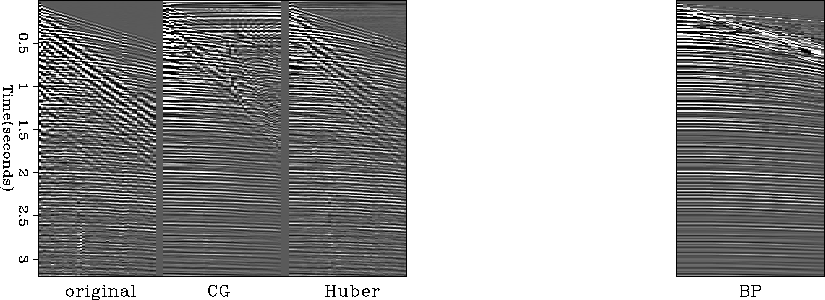
Figure 5 Velocity panel
comparison. The different output of the different programs makes direct
comparison impossible. The left panels scan to much higher velocity
than was necessary.
vbadsolo
Figure 6 Presentation of the
envelope of the velocity scan provides a better look at the location
of the focus of energy. The several vertical noise traces probably lead
to the poor quality of the predicted data (right panel, Figure
). Disappointingly, some events have bifurcated.
|
| 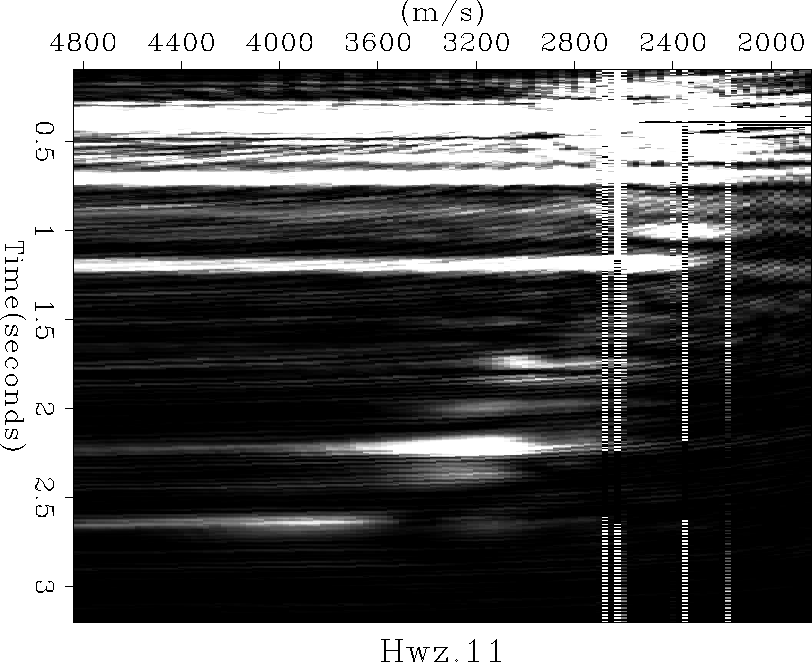 |


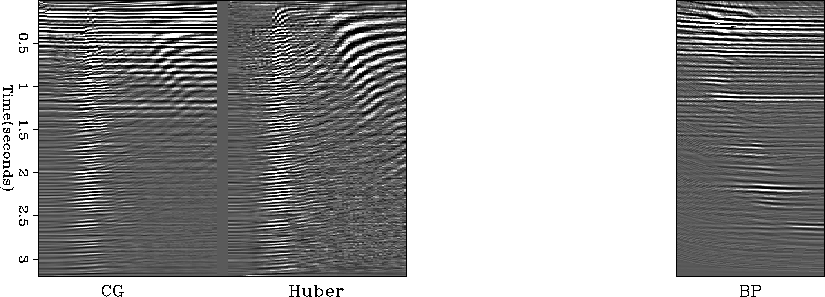
Figure compares the predicted data from CG least
squares inversion, the Huber norm inversion, and the BP inversion.
The BP solver had great difficulty with the multiples infested
CMP. The garbage in the low velocity range above 1.4 seconds is
troublesome. This may contribute to the
problems analyzing this data, as I may not have made the model space
large enough to achieve the necessary overcompleteness, or the linear
events are not well described by the hyperbolic dictionary.
This type of data is a good candidate to try the amalgamated
linear/hyperbolic radon transform of Trad et al. (2001).
mult
Figure 7 Modeled data after
inversion compared to original a CMP that suffers from internal
multiples and strong ground roll.
vmultsolo
Figure 8 Presentation of the
envelope of the velocity scan provides a better look at the location
of the focus of energy.
|
|  |
Next: Conclusion
Up: Experiments
Previous: Synthetic problems
Stanford Exploration Project
10/14/2003