


![[*]](http://sepwww.stanford.edu/latex2html/cross_ref_motif.gif) shows a fully-sampled plane wave previously used as a test case for PEF estimation
Brown et al. (2000). Nine traces (approximately 15 percent of traces) were removed from this model and were used to estimate a PEF.
The only inputs to the algorithm are the nine traces and the distances between the traces. The results are
promising, as the dip is easily recovered.
shows a fully-sampled plane wave previously used as a test case for PEF estimation
Brown et al. (2000). Nine traces (approximately 15 percent of traces) were removed from this model and were used to estimate a PEF.
The only inputs to the algorithm are the nine traces and the distances between the traces. The results are
promising, as the dip is easily recovered.
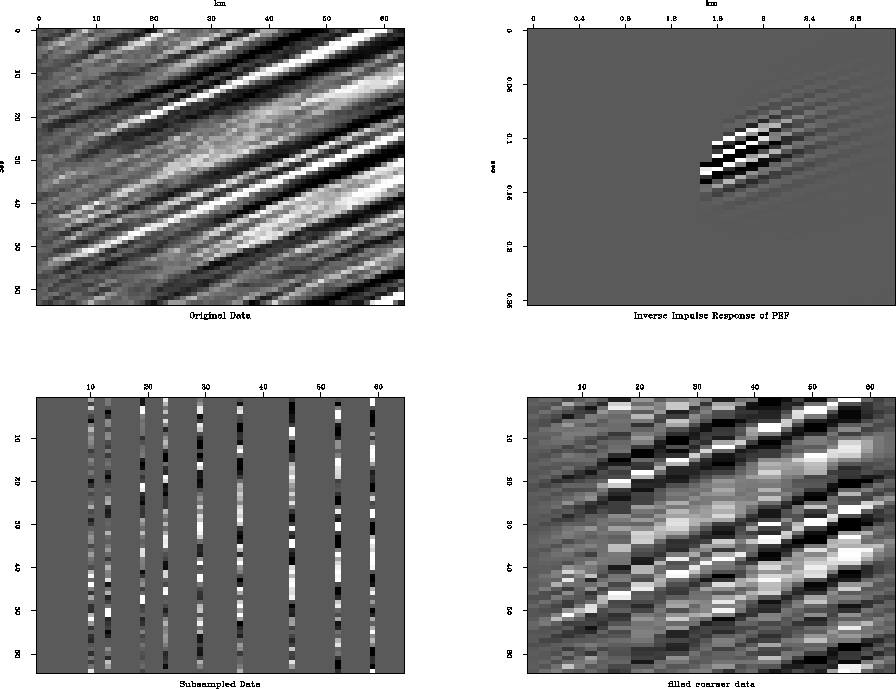 |


The inverse impulse response of the PEF, shown in Figure c, matches the dip of the original fully-sampled data.
Figure d contains a re-sampled version of Figure b, which was then interpolated with the PEF estimated on
the irregularly-sampled traces. The flat areas in that image are due to the re-sampling and not the PEF.