 |
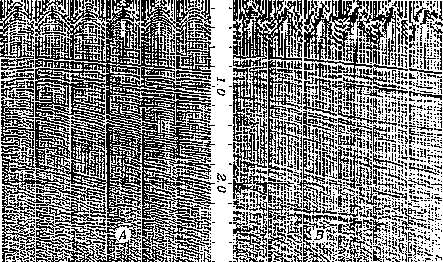
Figure 2 Field profiles before (left) and after (right) deconvolution. (distributed by GSI, circa 1965)
The water depth in Figure 1 is deeper than typical of petroleum prospecting. Figures 2 and 3 are more typical. In Figure 2, the depth is so shallow it is impossible to discern bounces. With land data the base of the weathered zone is usually so shallow and indistinct that it is generally impossible to discern individual reflections. The word shallow as applied to multiple reflections is defined to mean that the reflections recur with such rapidity that they are not obviously distinguished from one another.
Statisticians have produced a rich literature on the subject of deconvolution. For them the problem is really one of estimating a source waveform, not of removing multiple reflections. There is a certain mathematical limit in which the multiple-reflection problem becomes equivalent to the source-waveform problem. This limit holds when the reverberation is confined to a small physical volume surrounding the shot or the geophone, such as the soil layer. The reason that the source-waveform and multiple-reflection problems are equivalent in this limit is that the downgoing wave from a shot is not simply intrinsic to the shot itself but also includes the local soil resonances. The word ghost in reflection seismology refers to the reflection of the source pulse from the surface (or sometimes from the base of the weathered layer). Because the source is so near to these reflectors, we often regard the ghost as part of the source waveform too.
An extensive literature exists on the vertical-incidence model of multiple reflections. Among wave-propagation theorists, the removal of all multiples is called inversion. It seems that for inversion theory to be applicable to the real problem, the theory must include a way to deal with an unknown, spectrally incomplete, shot waveform.
Routine work today typically ignores inversion theory and presumes the mathematical limit within which multiples may be handled as a shot waveform. The basic method was first developed for the industry by Schneider, Larner, Burg, and Backus [1964] of GSI (Figure 2.
 |
Despite many further theoretical developments and the continuing active interest of many practical workers, routine deconvolution is little changed.
Conventional industrial deconvolution (Figure 2 has many derivations and interpretations. I will state in simple terms what I believe to be the essence of deconvolution. Every seismogram has a spectrum. The spectrum is a product of many causes. Some causes are of fundamental interest. Others are extraneous. It is annoying when a seismogram is resonant just because of some near-surface phenomena. Deconvolution is basically a process in which strong resonances are measured, and then a filter is designed to suppress them. The filter is designed to have a spectrum that is roughly inverse to the spectrum of the raw data. Thus the output of the filter is roughly white (equal amounts of all frequencies). From the earliest times, seismologists have found that reflection seismic data rarely makes sense much outside the frequency band 10-100 Hz, so as a final step, frequencies outside the band are removed. (The assumption that the output spectrum should be white seems to most seismologists to be a weak assumption, but practice usually shows it better than interpreting earth images from raw data).
Another nonmathematical explanation of why deconvolution is a success in practice is that it equalizes the spectrum from trace to trace. It balances the spectra (Tufekcic et al [1981]). Not only is it annoying when a seismogram is resonant just because of some near-surface phenomena, but it is more annoying when the wave spectrum varies from trace to trace as the near surface varies from place to place. A variable spectrum makes it hard to measure stepouts. Notice that the conventional industrial deconvolution described above includes spectral balancing as a byproduct. Figure 3 shows data that needs spectral balancing.
|
multiples20
Figure 3 Profile from the North Sea. (Western Geophysical) Observe strong reverberations with a period of about 90 ms. These are multiple reflections from the sea floor. Note that the strongest signal occurs at increasing offset with increasing time. This is because the strongest multiples are often at critical angle. The strength of the reverberation diminishes abruptly 1.8 km behind the ship. This implies that the sea floor changes abruptly at that point. |  |
The above interpretation of deconvolution and why it works is different from what is found in most of the geophysical literature. Deconvolution is often interpreted in terms of the predictability of multiple reflections and the nonpredictability of primary reflections. It is shown in FGDP how multiple reflections are predicted. They are predicted, not by a strictly convolutional model, but approximately so. Prediction by convolution works best when the reverberation is all in shallow layers. Then it is like a source waveform.
Cardiovascular research is well integrated with routine practice, whereas pulmonary research is not. I compare this to migration and velocity theory being a good guide to industrial practice, whereas deconvolution theory is less so. The larger gap between theory and practice is something to be aware of. Some fields are more resistant to direct attack. In them you progress by more indirect routes. This is confusing for the student and demoralizing for the impatient. But that is the way it is. For more details, see Ziolkowski [1984].
The next few pages show land data with buried geophones confirming that source waveforms are mainly near-surface reverberation. Then we turn to departures from the convolutional model.