

Next: Common-midpoint Snell coordinates
Up: INTERVAL VELOCITY BY LINEAR
Previous: INTERVAL VELOCITY BY LINEAR
A wave of velocity v from a point source
at location  passes any point (x,z) at time t where
|  |
(39) |
In equation (39) x should be replaced by either
half-offset h or midpoint y.
Then t is two-way travel time;
the velocity v is half the rock velocity;
and  is the distance to an image source.
Differentiating (39) with respect to t (at constant z) gives
|  |
(40) |
| (41) |
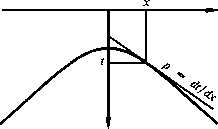
Figure 14
shows that the three parameters required by (41) to compute the
material velocity are readily measured on a common-midpoint gather.
tangent
Figure 14
A straight line, drawn tangent to hyperbolic observations.
The slope p of the line is arbitrary and may be chosen so that
the tangency occurs at a place where signal-to-noise ratio
is good. (Gonzalez)
|
|  |

Equation (41) can be used to estimate a velocity
whether or not the earth really has a constant velocity.
When the earth velocity is stratified, say, v(z),
it is easy to establish that the estimate (41)
is exactly the root-mean-square (RMS) velocity.
First recall that the bit of energy arriving at the point of tangency
propagates throughout its entire trip
with a constant Snell parameter  .
.
The best way to specify velocity in a stratified earth
is to give it as some function v' (z).
Another way is to pick a Snell parameter p and start descending
into the earth on a ray with this p.
As the ray goes into the earth
from the surface  at
at  ,the ray will be moving with a speed of, say, v (p,t).
It is an elementary exercise to
compute v (p,t) from v' (z) and vice versa.
The horizontal distance x which a ray
will travel in time t is given by
the time integral of the horizontal component of velocity, namely,
|  |
(42) |
Replacing  by pv and taking
the constant p out of the integral yields
|  |
(43) |
Recalling that  ,recopy (41) and insert (43):
|  |
(44) |
| (45) |
which justifies the assertion that
|  |
(46) |
Equation (45) is exact.
It does not involve a ``small offset'' assumption
or a ``straight ray'' assumption.
Next compute the
interval
velocity.
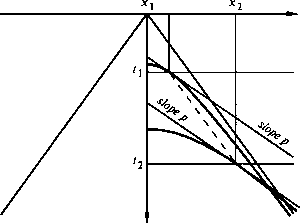
Figure 15 shows hyperboloidal arrivals from two flat layers.
tan2
Figure 15
Construction of two parallel lines on
a common-midpoint gather which are tangent
to reflections from two plane layers. (Gonzalez)

Two straight lines are constructed to have the same slope p.
Then the tangencies are measured to have locations ( x1 , t1 )
and ( x2 , t2 ).
Combining (44) with (42),
and using the subscript j to denote
the  tangency ( xj , tj ), gives
|  |
(47) |
Assume that the velocity between successive events
is a constant  , and subtract (47) with j+1 from
(47) with j to get
|  |
(48) |
Solving for the interval velocity gives
|  |
(49) |
So the velocity of the material between
the  and the
  reflectors can
be measured directly using the square root
of the product of the two slopes in (49), which are the
dashed and solid straight lines in Figure 15.
The advantage of manually placing straight lines on the data,
over automated analysis, is that you can graphically visualize
the noise sensitivity of the measurement,
and you can select
on the data the best offsets at which to make the measurement.
If you do this routinely you
quickly discover that the major part of the effort
is in accurately constructing two lines that are tangent to the events.
When you run into difficulty,
you will find it convenient to replot
the data with linear moveout  .After replotting, the lines are no longer sloped but
horizontal, so that any of the many timing lines can be used.
Locating tangencies is now a question of finding the tops of convex events.
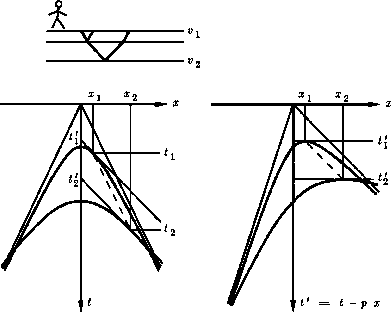
This is shown in Figure 16.
tan3
Figure 16
Measurement of interval velocity by linear moveout. (Gonzalez)

In terms of the time t', equation (49) is
|  |
(50) |
Earth velocity is measured on the right side of Figure 16
by measuring the slope of the dashed line,
namely  , and
inserting it into equation (50).
(The value of p is already known by the amount of linear
moveout that was used to make the plot).


Next: Common-midpoint Snell coordinates
Up: INTERVAL VELOCITY BY LINEAR
Previous: INTERVAL VELOCITY BY LINEAR
Stanford Exploration Project
10/31/1997
![]() passes any point (x,z) at time t where
passes any point (x,z) at time t where


![]() .
.![]() at
at ![]() ,the ray will be moving with a speed of, say, v (p,t).
It is an elementary exercise to
compute v (p,t) from v' (z) and vice versa.
The horizontal distance x which a ray
will travel in time t is given by
the time integral of the horizontal component of velocity, namely,
,the ray will be moving with a speed of, say, v (p,t).
It is an elementary exercise to
compute v (p,t) from v' (z) and vice versa.
The horizontal distance x which a ray
will travel in time t is given by
the time integral of the horizontal component of velocity, namely,


![]() tangency ( xj , tj ), gives
tangency ( xj , tj ), gives
![]() and the
and the ![]() reflectors can
be measured directly using the square root
of the product of the two slopes in (49), which are the
dashed and solid straight lines in Figure 15.
The advantage of manually placing straight lines on the data,
over automated analysis, is that you can graphically visualize
the noise sensitivity of the measurement,
and you can select
on the data the best offsets at which to make the measurement.
reflectors can
be measured directly using the square root
of the product of the two slopes in (49), which are the
dashed and solid straight lines in Figure 15.
The advantage of manually placing straight lines on the data,
over automated analysis, is that you can graphically visualize
the noise sensitivity of the measurement,
and you can select
on the data the best offsets at which to make the measurement.
![]() .After replotting, the lines are no longer sloped but
horizontal, so that any of the many timing lines can be used.
Locating tangencies is now a question of finding the tops of convex events.
This is shown in Figure 16.
.After replotting, the lines are no longer sloped but
horizontal, so that any of the many timing lines can be used.
Locating tangencies is now a question of finding the tops of convex events.
This is shown in Figure 16.
