|
freqdisp
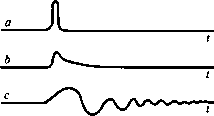
Figure 17 (a) A pulse. (b) A pulse slightly dispersed as by the physical dissipation of high frequencies. (c) A pulse with a substantial amount of frequency dispersion, such as could result from careless data processing. |  |
Frequency dispersion results from different frequencies propagating at different speeds. The physical phenomenon of frequency dispersion is rarely heard in daily life, although many readers may have heard it while ice skating on lakes and rivers. Elastic waves caused by cracking ice propagate dispersively, causing pops to change into percussive notes. Frequency dispersion is generally observable on seismic waves that propagate along the earth's surface but frequency dispersion is hardly ever perceptible on internally reflected waves. In seismic data processing, frequency dispersion is a nuisance and an embarrassment to process designers. It arises mainly with the finite differencing method because differential operators and difference operators do not coincide at high frequencies. Frequency dispersion can always be suppressed by sampling more densely, and it is the job of the production analyst to see that this is done. Figure 17 depicts some dispersed pulses.
|
freqdisp
Figure 17 (a) A pulse. (b) A pulse slightly dispersed as by the physical dissipation of high frequencies. (c) A pulse with a substantial amount of frequency dispersion, such as could result from careless data processing. |  |
Frequency dispersion caused by data processing can be a useful warning that the data is in danger of being aliased. Frequency-domain methods do not depend on difference operators, so they have the advantage of not showing dispersion. The penalties that go along with this advantage are (1) limitation to constant material properties, (2) wraparound, and (3) the occurrence of spatial aliasing without the warning of dispersion.
 |
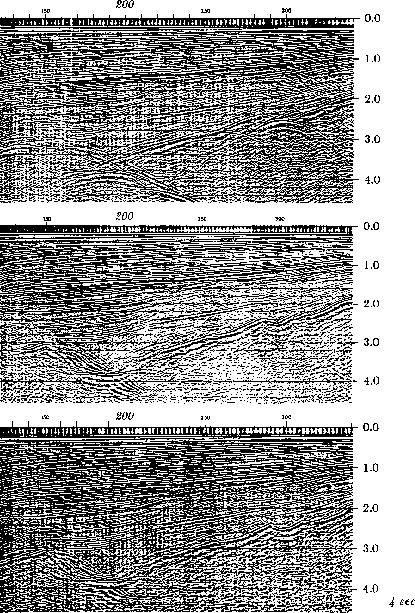
Figure 18 shows an example of frequency dispersion in migrated data. At the top of the figure is a CDP stack. In the middle is the data after processing with no attempt to control frequency dispersion. The worst dispersion is near shot point 200 at 4 seconds. The bottom shows the data after reprocessing with greater attention to dispersion.