CRYING WOLF: Warnings about oil supply
Michael C. Lynch , M.I.T., March 1998 (mclynch@aol.com, wilfrid@mit.edu, michael.lynch@wefa.com)
"[Vannevar Bush] never flatly refused to satisfy a politician's curiosity, but rather dared him to comprehend the technical and military issues. Most politicos wisely kept their mouths shut." From a review of "Endless Frontier" by G. Pascal Zachary, Wall Street Journal, 10/21/97, A20.
In the past two years, a number of articles have appeared warning not only of a new oil crisis, but of the end of the oil era, as oil production inevitably peaks and declines due to inexorable geological forces. These include "Mideast Oil Forever?" by Joseph J. Romm and Charles B. Curtis and "Heading Off the Permanent Oil Crisis," by James J. MacKenzie, among others.
The profusion of articles on the subject is unfortunate, since the casual reader (and policy-maker) might conclude that the large number of articles have an equally large amount of research behind them. In truth, most of these are not actually about oil, but take the assumption that oil scarcity is imminent, especially outside the Middle East, and nearly all rely on a few pessimistic quotes from oil men, or recent work by one or two geologists using what is known as a "Hubbert approach." Most notable are the recent publication of the book The Coming Oil Crisis by Colin Campbell and the March 1998 Scientific American article "The End of Cheap Oil" by Colin J. Campbell and Jean H. Laherrere.
The gist of their argument is that most of the world's oil has already been found, as evidenced by the alleged lack of recent giant discoveries; Middle East reserves have been overstated for political reasons; actual total recoverable resources are only about 1.8 trillion barrels, not the 2.4 trillion barrels that others have estimated; existing fields will not continue to expand in size and production as others suggest; and most oil producing countries outside the Middle East are said to be near, if not past, their point of peak production, which occurs when 50% of total oil resources have been produced. Production is predicted to drop off steeply afterwards. Thus, they forecast that "The End of Cheap Oil" is at hand and prices will be rising shortly.
Understanding Forecasts (Good and Bad)
These issues are hugely complex. A wide variety of political, economic and geological factors affect oil production, and analysis requires an enormous amount of data, much of which is either not readily available or is unreliable. Few observers have the capacity to analyze the forecasts of others, let alone make their own forecasts. Thus, as Vannevar Bush realized, when an expert, particularly with a scientific background, comes forward with detailed work and large quantities of (albeit hidden) data, it gains almost instant respectability, particularly among editors who are not familiar with the subject.But there are several methods of judging research that don't involve time-consuming or labor-intensive analysis. For one thing, analysts who don't acknowledge either data or research which contradicts their theories are implying they can't explain inconsistencies or weakness in their work. Because in a complex system like world oil production, there is always some data which can support alternative viewpoints. Dry holes are always being drilled and new fields are always being found, and citing one or the other to support pessimism or optimism proves nothing.
A better way to test forecast validity is to look at the historical record, and particularly, examine work done by the person making the forecast in question. In 1992, I did precisely this to improve long-term oil price forecasting. The realization that the previous errors were due to forecasters assuming a 3% per year increase in real oil prices over the long-term made it possible to produce much more accurate forecasts.
In 1996, I published a piece discussing the various methods which were used to forecast oil supply, and argued that they, too, were flawed by certain repetitive errors, namely: 1) bias, and especially pessimism, since nearly every forecast has been too low since 1978, despite relying on price assumptions that were much too high; 2) similar forecasts for every region, despite different fiscal systems, drilling levels and/or the maturity of the industry, suggesting omitted variables; 3) misinterpretation of recoverable resources as total resources by using a point estimate instead of a dynamic variable, growing with technology change, infrastructure improvements, etc.; so that 4) there is a tendency for all national, regional or non-OPEC production forecasts to show a near-term peak and decline, which was always moved outward and higher in later forecasts (the opposite of price forecasts).
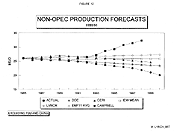
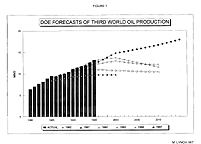 As an example, note the behavior of the U.S. Department of Energy's production forecasts for the
non-OPEC Third World, a region which, in aggregate, has experienced very little drilling and
shows no sign of peaking, causing the forecasts to be repeatedly revised upwards.
(Figure 1) I
have numerous other such examples, for various countries and regions, as well as the globe. Few,
if any, have been too optimistic.
The Case in Question: Campbell
 Thus, an examination of the history of forecasts performed by these gentlemen is in order. First,
the company Petroconsultants, which both men have been associated with in the past and which
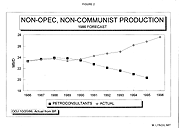
published Campbell's 1997 book, published a nearly identical forecast in 1986, which showed
regional production to 1995, at $25/barrel (equal to about $35/bbl in 1997$). The forecast
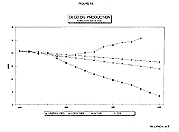
incorrectly put non-OPEC, non-Communist production at 20 mb/d in 1995 and dropping, when in
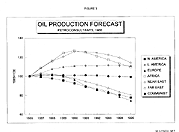
reality it was 28 mb/d and rising. (Figure 2) Figure 3 shows the regional forecasts, normalized to
1986=100 to show the rates of change. Note that all regions peak within the time horizon of the
forecast. It is not clear if either Campbell of Laherrere was involved in producing this forecast,
however, they are employing the same database of oil fields, and their results are suspiciously
similar.
Subsequently, Campbell published an article in the December 1989 Noroil which stated that
His figure shows world oil production (including the Middle East) peaking in the late 1980s, and
dropping sharply, from about 58 mb/d to 45 mb/d, with the comment that "Any short-term
increase steepens subsequent decline." He also shows prices rising to the low $20s (about $27 in
1997$) as "increasing probability" with an "anticipated price leap from increased perception of
declining reserves, falling non-Middle East production, and falling exports, esp. from USSR." He
predicted this might cause oil prices to reach $50/bbl (about $65 in 1997$) by 1994, then fluctuate
around that level to the end of the century.
 "Most economic forecasts see relatively stable prices over the near future followed by a
ramp of modest increase to the end of the century. But
Figure 3 suggests that the slope of
declining supply will become a precipice if production is held at present levels, never mind
increasing. When that happens, a major leap in prices seems inevitable unless the major
exporting governments exercise deliberate restraint....Shortages seem to be inevitable by
the late 1990s, but knowledge of an impending supply shortfall may trigger an earlier price
response, as foreseen in the Figure."
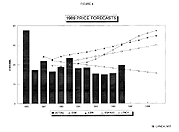 That same year, my Oil Prices to 2000 was published, taking the contrary view. I argued that
most forecasts were too pessimistic about non-OPEC production and predicted that inflation-adjusted prices would fall to 2000, which the September 1989 Petroleum Economist correctly
noted was "heretical". Yet this proved quite accurate, as a comparison of forecasts from that
period shows (Figure 4) .
(Later figures will compare production forecasts.) Since Campbell
(1989) includes only a graph of his price forecast, it is not shown here, but by the mid-1990s, he
showed prices fluctuating around $50/bbl, about 200% too high.
The 1991 Forecast: Deja vu all over again?
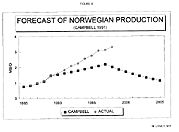
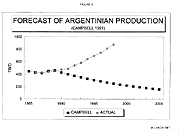
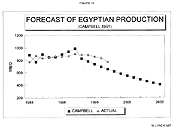
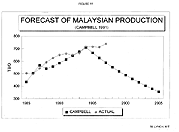
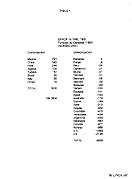 Campbell's 1991 book is more illuminating, and damning, since he provides detailed production
tables for most countries, including 32 non-Middle East, non-FSU producing countries which
account for 36.8 mb/d in 1996. The aggregate error by 1996 is 7.9 mb/d, or 21.5% of production
in those countries, as Table 1
shows. Twenty-four of the forecasts are too low, and eight are
too high. An examination of the particular countries' errors is instructive about their nature.
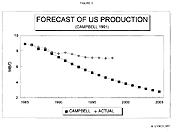
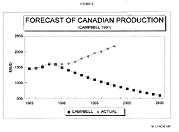
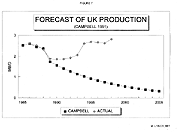
For example, except for Italy, Tunisia and Oman, in all of the countries where Campbell's forecast is too high, the upstream sector is controlled by national oil companies. This shows the importance of policy and economics, refuting the argument that geology alone determines long-term production profiles. If Campbell is said to be projecting possible, not actual production, so that his error on these countries should be disregarded, then it leaves a total "optimistic" error of only 106 tb/d, a trivial amount. This demonstrates clearly that his method is biased in a scientific sense, always producing forecasts which will tend to be too low.
|
|
|
|
|
|
|
In fact, what is remarkable is the similarity between Campbell's 1989, 1991 and 1997/98 forecasts (if one ignores the dates). Always, the peak is imminent. But this precisely conforms to the argument in Lynch (1996), namely that this method almost always produces a near-term peak, no matter when or where it is applied, and thus constantly needs to be revised upwards.
Broader Comparison
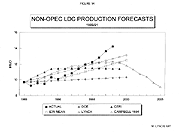
It might be thought that Campbell has simply reproduced the poor forecasts so often seen in the oil industry, but his errors are larger than most. As a test of the validity of my own 1989 forecast, I had earlier assembled other forecasts from that period for comparison, and to these I add Campbell's projections. The fact that his work was done two years later than the others (although EMF11 was also 1991), should provide him with an advantage, since he has two more years of data to observe and any inherent errors in his work will have less of an impact because of the shorter test period. Again, the forecasts are all normalized to common starting points, and some points are interpolated.
|
|
|
1997/98: Deja Vu All Over Again Again
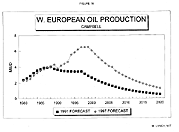
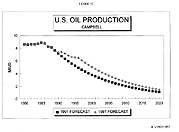
In 1997 and 1998, C. J. Campbell published a book and two Oil and Gas Journal articles which argued that the price of oil is about to increase, since most major oil producing nations outside the Middle East are reaching their depletion midpoints, after which production will decline, and decline sharply. Essentially this is the same argument from his 1989 and 1991 work, namely that oil production will imminently peak in all major countries outside the Middle East and global production cannot go much higher than the present amount. Since he is clearly using precisely the same methodology, and does not explain the failure of his earlier predictions, it appears that all he has done is update his data, increase his resource estimates and production forecasts, and move his production peaks higher and further out, exactly as Lynch (1996) contended would be necessary with this method.
|
|
|
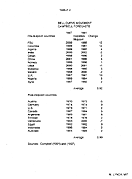 In his 12/29/97 OGJ article, he did present a number of small graphs showing bell curves for a
variety of countries, some which he described as being past their depletion midpoint, some of
which had not yet reached it. These are shown in
Table 2 , along with the depletion midpoint
which he gave in his 1991 book, and they reaffirm my earlier arguments. The fact that all of these
countries are predicted to peak by 2001 implies that there is a pessimistic bias (#1 and 2 from Lynch
1996 above). And his having to move the depletion midpoint out an average of 4 years for the
countries which haven't peaked supports the argument (#4 from Lynch 1996 above) that this
method always requires correction, and that the peak constantly needs to be revised to a higher,
later level.
Conclusion
If Campbell's estimation methods produce accurate, rather than conservative, resource estimates, overcoming the objections about field and resource growth made by Adelman and Lynch, and if the Petroconsultants field size estimates are accurate because they don't have to conform to SEC rules requiring conservative field size reporting, why have his production forecasts been much too low and why have his resource estimates increased?
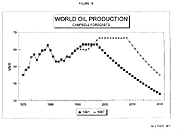
 Lynch (1996) argued that the Hubbert method fails because it takes recoverable (not total)
resources as fixed, and assumes that to be the area under the curve of total production. When the
estimate of the area under the curve (resources) is increased, the entire increase must be applied
to future production. This is exactly what is happening with Campbell, as Figure 15 shows. The
errors in his 1991 forecast and the adjustments he has made in his latest work are thus predicted
by Lynch (1996). Campbell has not provided an alternative explanation, merely ignored them.
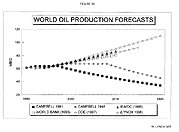
And as Figure 18 shows, his forecast is well outside the mainstream.
Short-term prices will certainly fluctuate, and we will surely have more oil crises, since they are short-term events. Unfortunately, there is little doubt that the certain failure of the current Cassandras will be forgotten within a few years and a new round of alarms will be sounded. Hopefully, it will not receive the attention that the current (and previous) ones did, and even more hopefully, most governments and companies have already learned their lesson from the tens of billions of dollars wasted when others cried wolf during the 1970s.