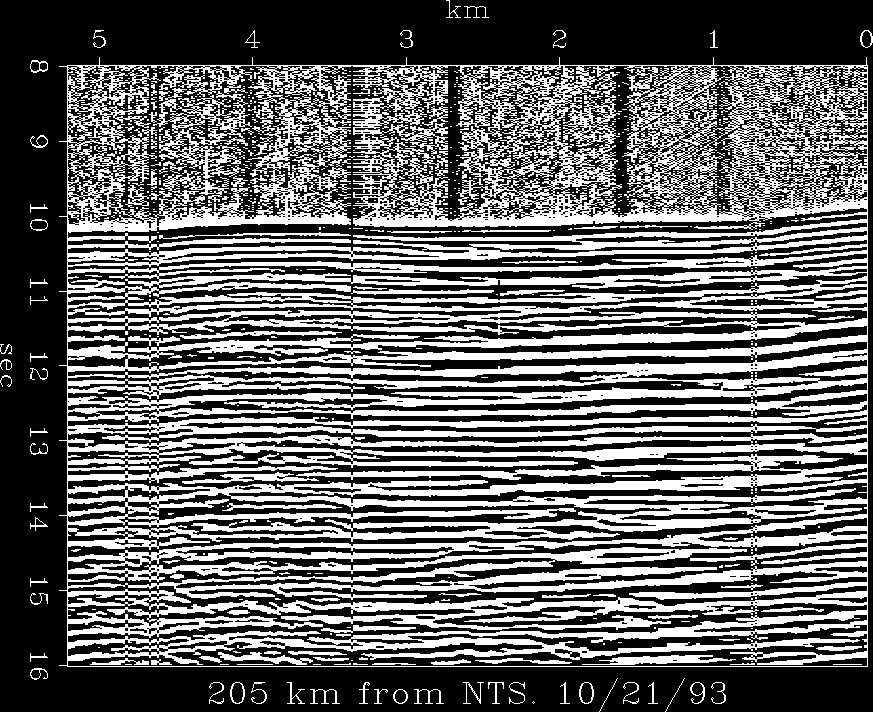
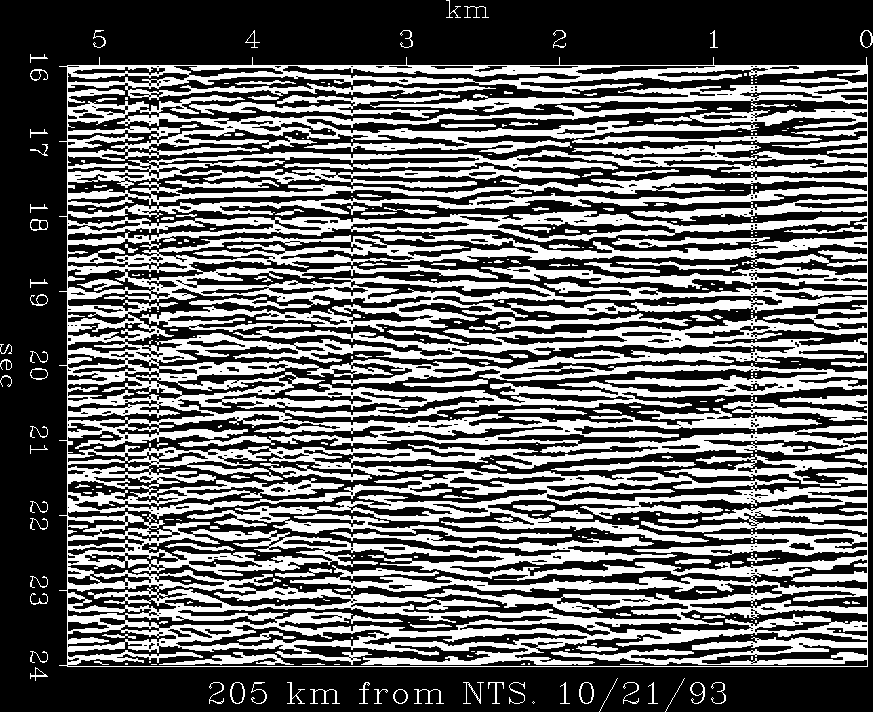
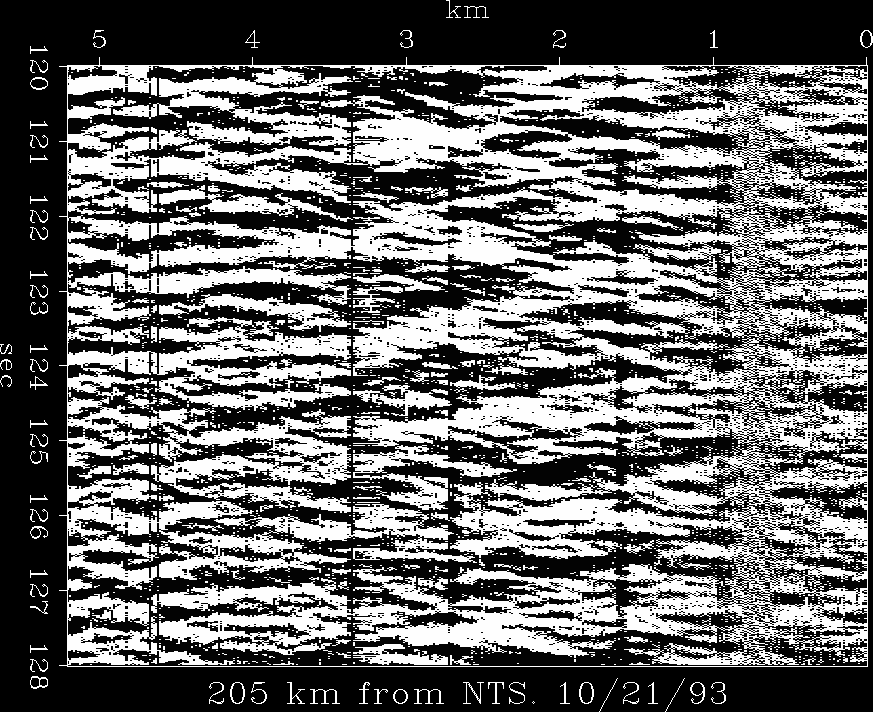
600 channel recording of pseudo nuclear bomb
by
Jon Claerbout
|
Thirty or forty years ago,
underground nuclear explosions were common
but computers and high density seismology were unknown.
International treaty now prohibits such explosions,
a benefit to humanity, but a loss to seismology.
In 1993 at the Nevada Test Site (NTS) there was
a chemical explosion of 1.3 kilotons.
Fortuitously, the
Subsurface Exploration Company
of Pasadena, CA
was operating a 609 channel petroleum-exploration
seismic array 200 km distant.
This recording equipment was activated at midnight
and recorded the blast.
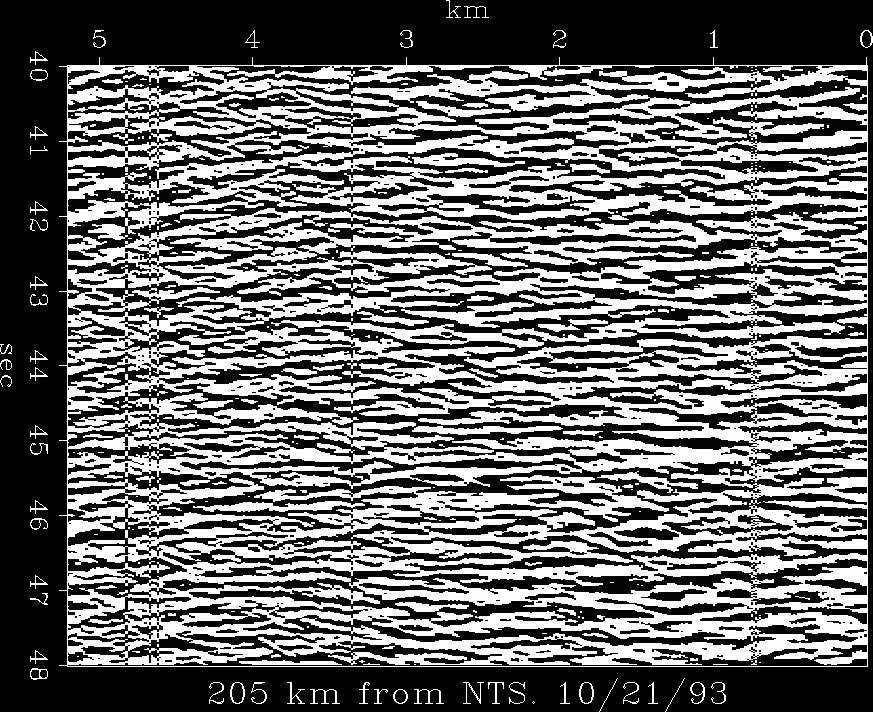
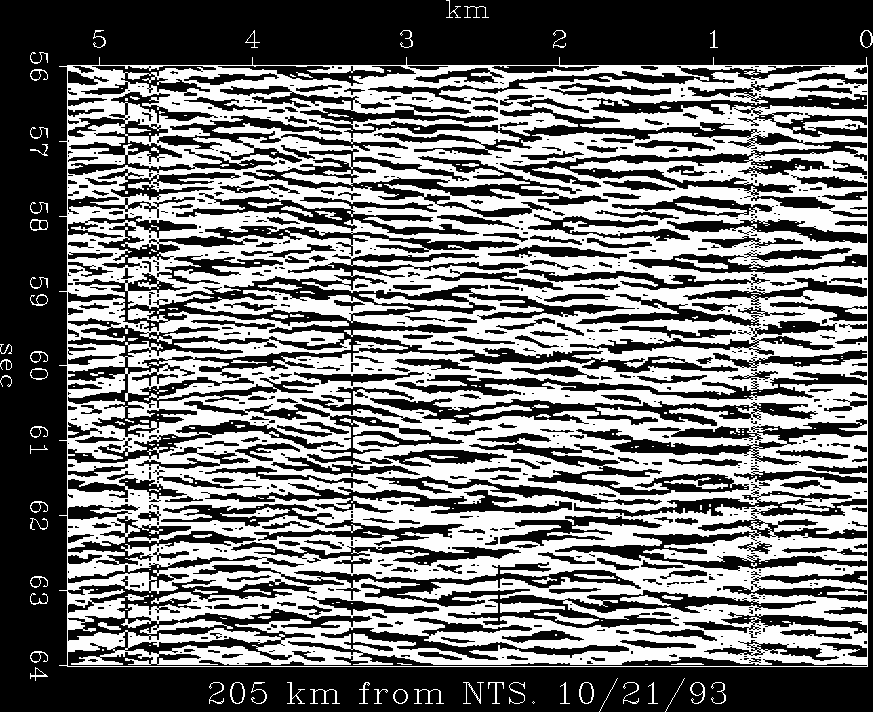
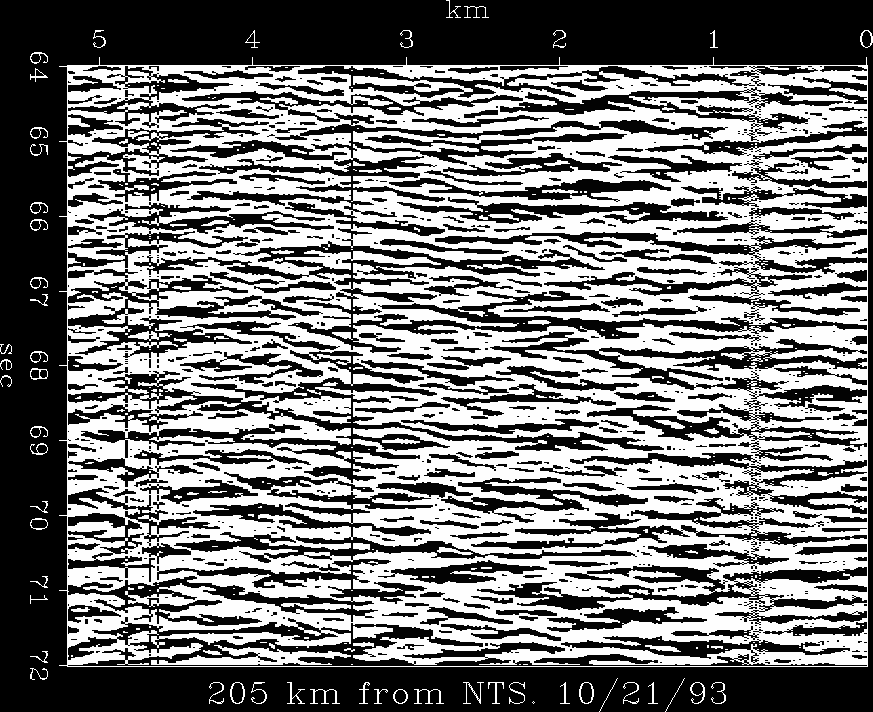
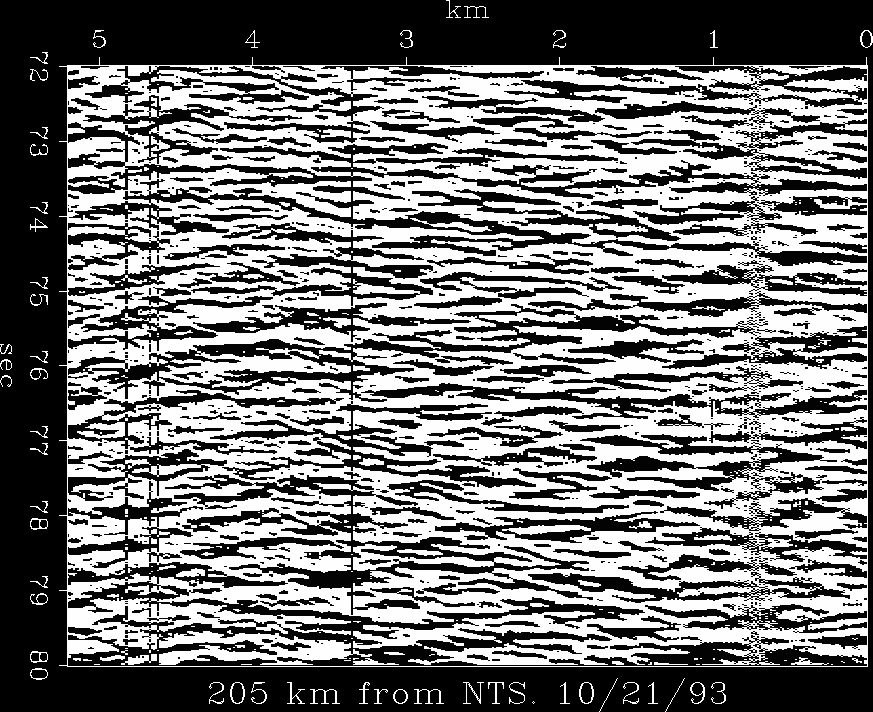
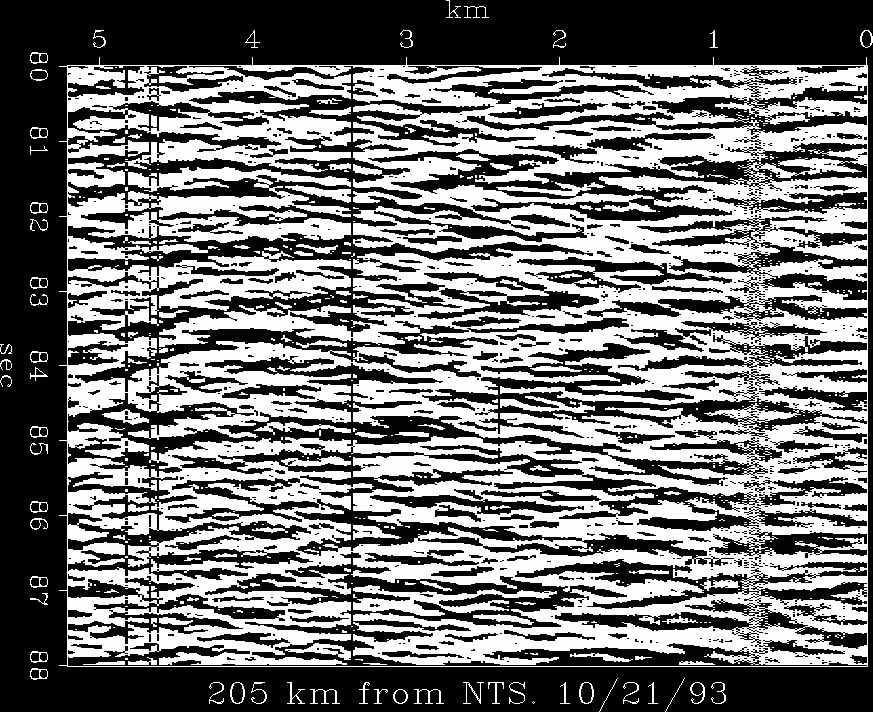
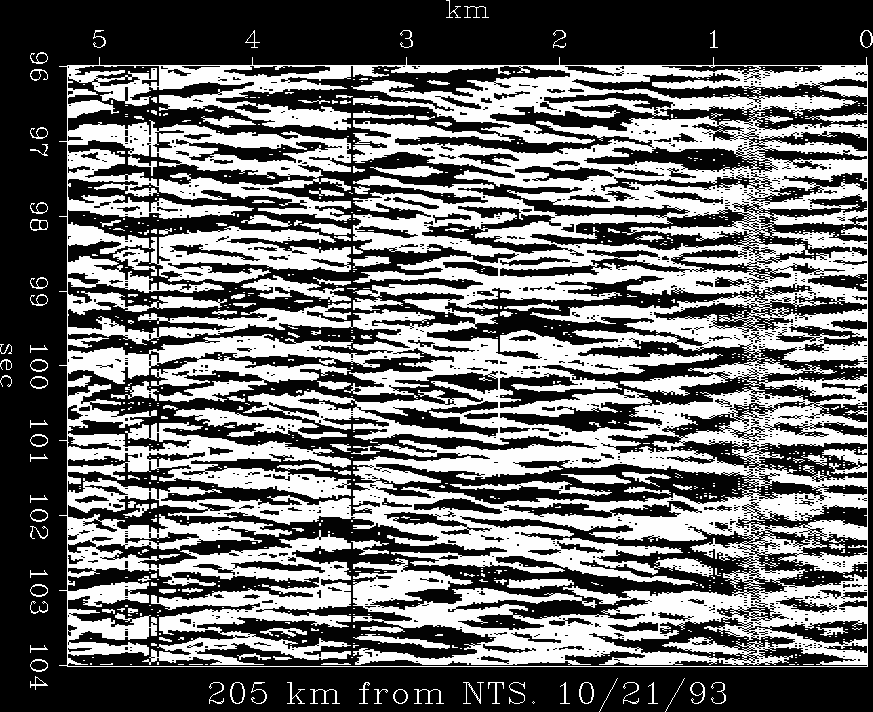
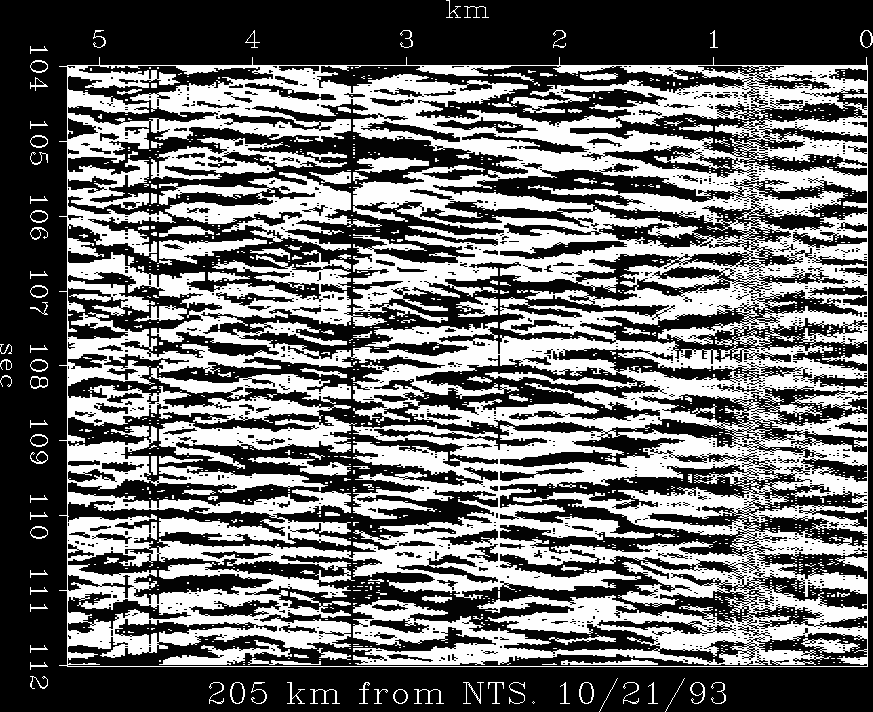
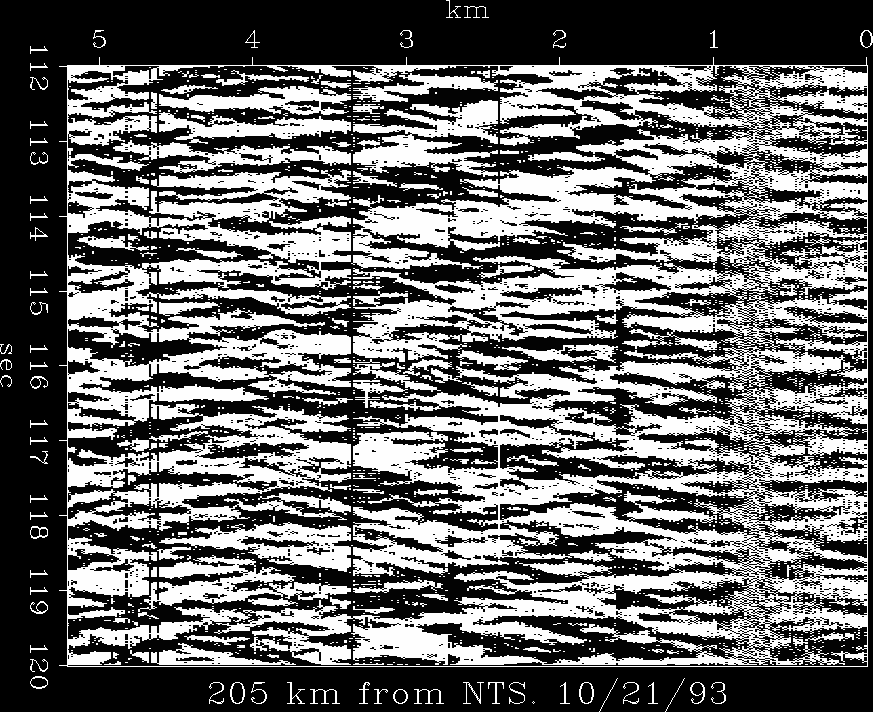
This data set is remarkable in two respects:
-
The 609 channel linear array is transverse to the direction of propagation.
On a layered earth, all 609 channels would exhibit the same signal,
yet we see they are remarkably diverse.
- The recorders are open to much higher frequencies
than conventional earthquake seismometry.
Here we see 10 Hz energy.
This remarkable data set was nearly lost now
I have a tape image here and a movie of it.
We have recovered only the first two minutes of what
is thought to be a 20-30 minute recording.
The time axis is so long that I present it as 16 frames
of 8 seconds each.
You'll notice the frequencies getting lower with time
as the angular bandwidth increases.
The lateral variations on this data contradict the assumptions
of most people's seismic data analysis which expects no variation
transverse to the wavefront.
|
|
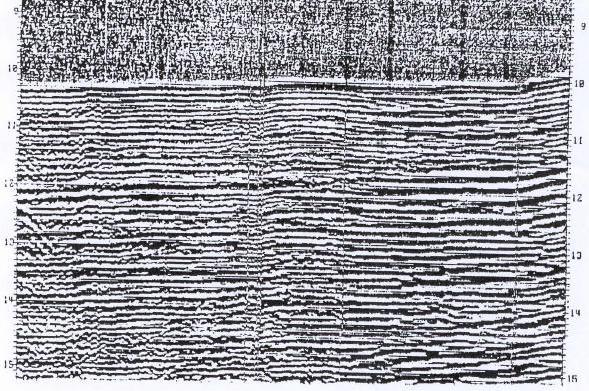
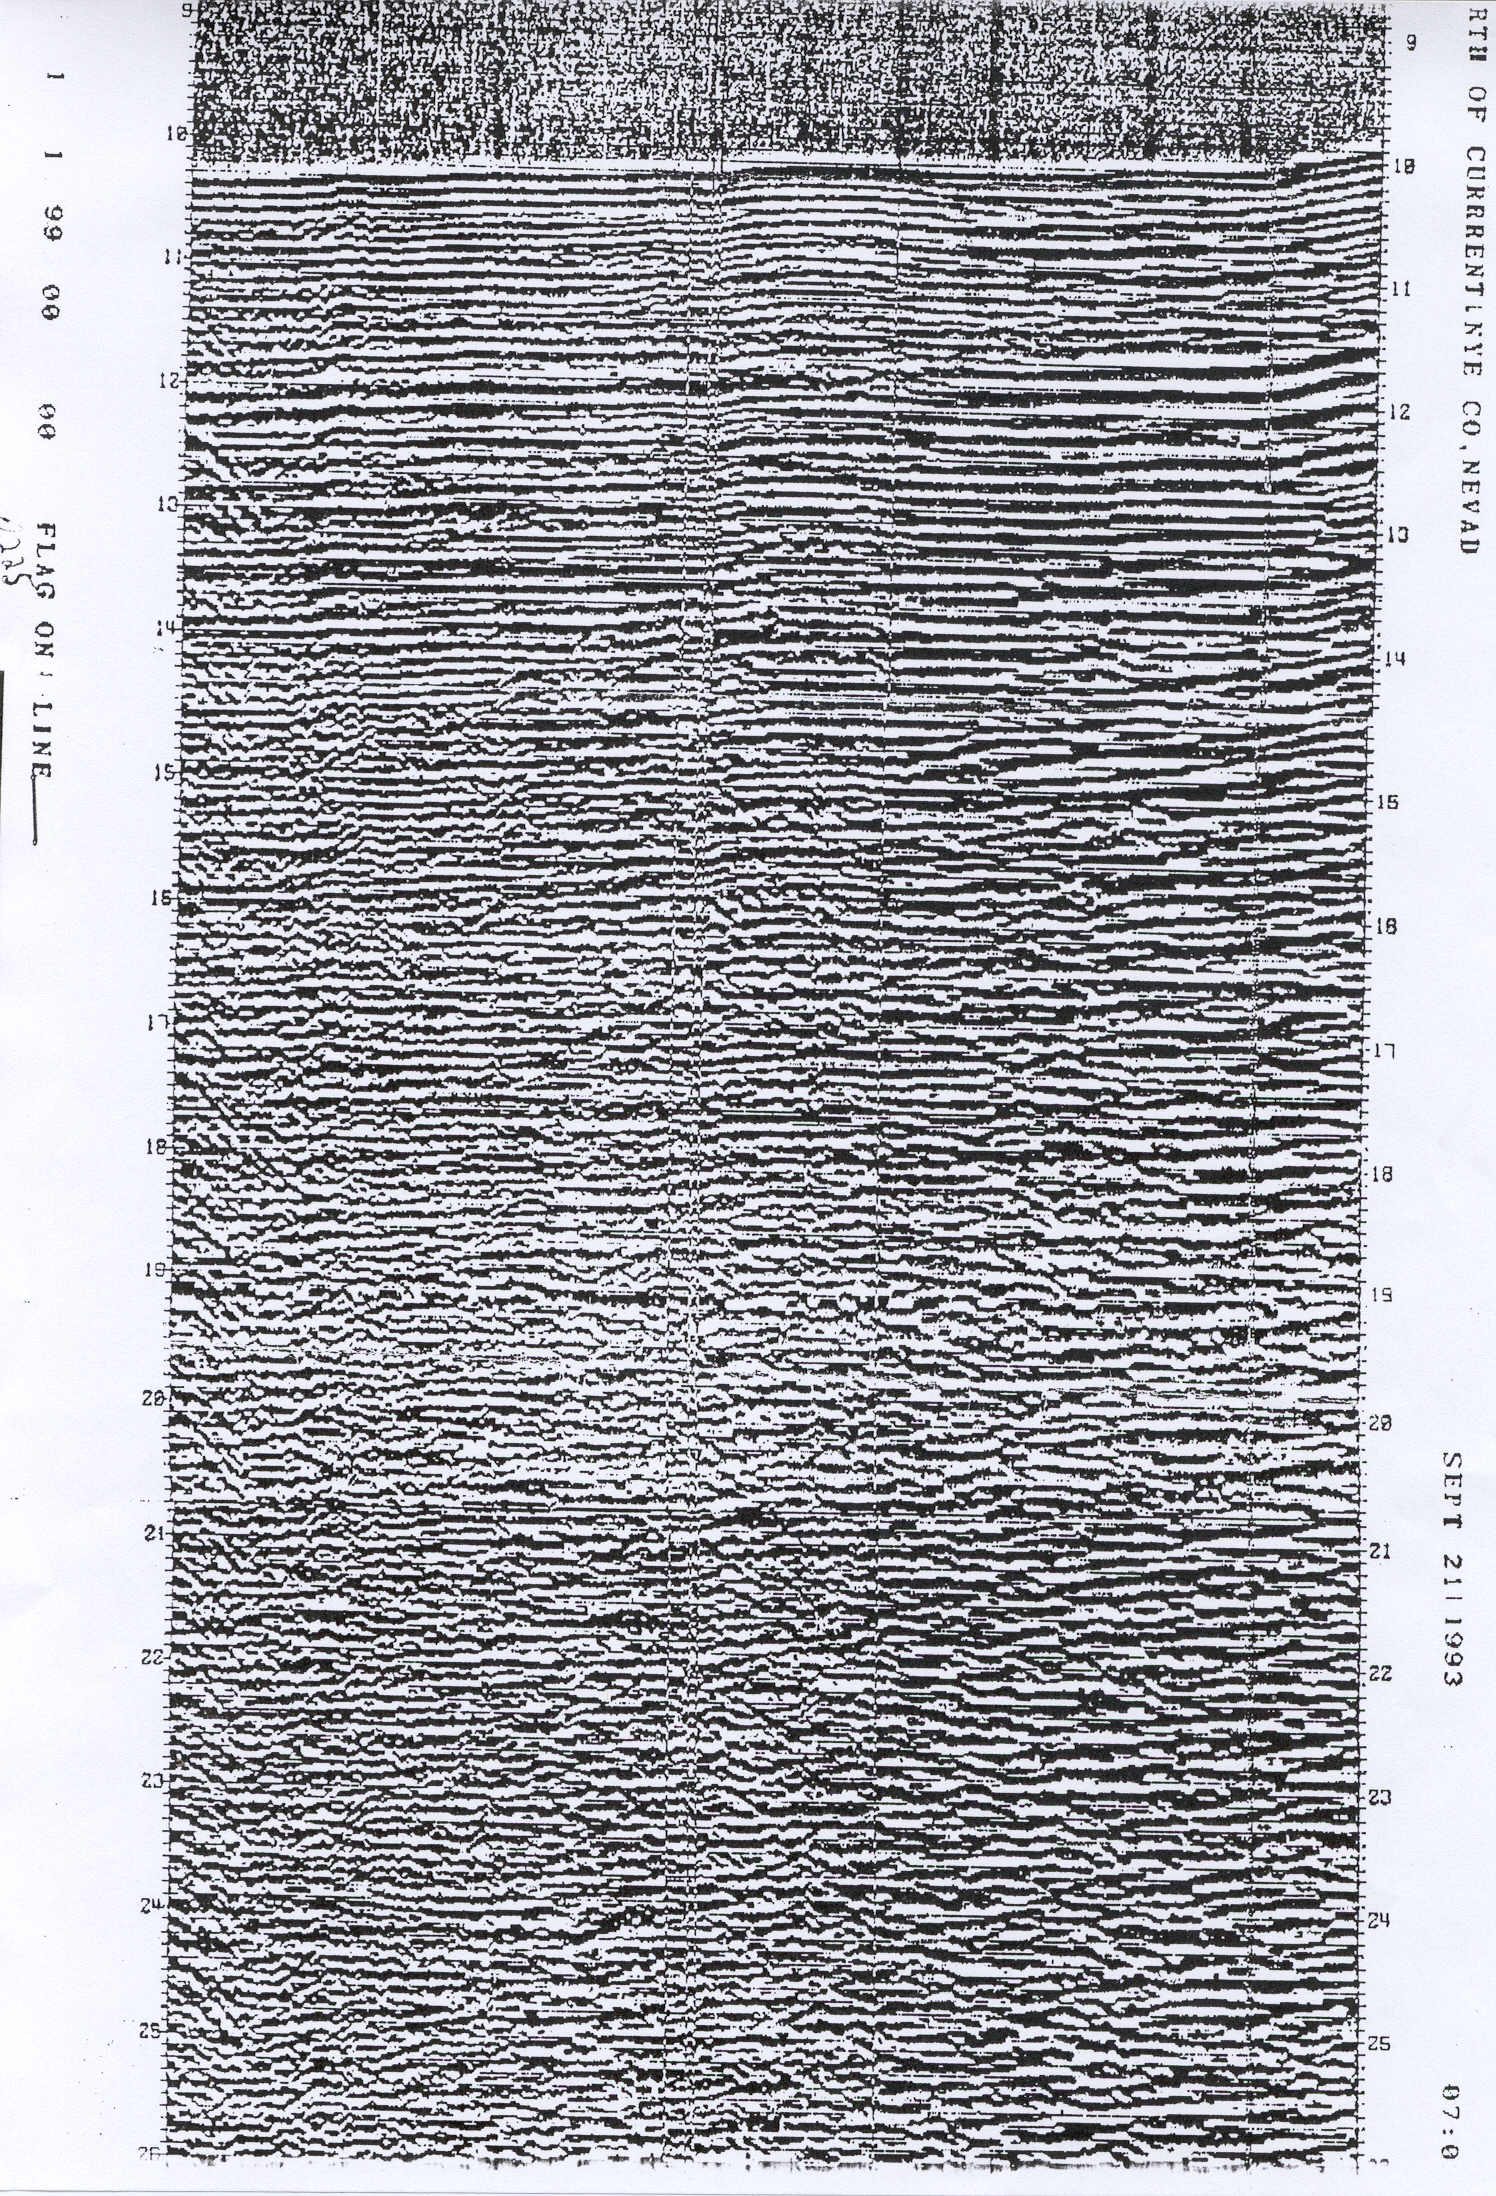
In late 1993, Sam Allen showed me this recording on a long spool of paper.
I dashed to a copy machine and saved the first 10" or so.
Click on the illustration for an enlargement of this piece of paper.
The data is recorded along a road that is quite straight
except there is a bend in the road such that the rightmost
60 channels (about) exhibit the first arrival at
somewhat earlier times (reaching about 100ms at the rightmost
end of the line).
The data is recorded "sign bit".
In 2001 I acquired a
data tape
via Rob Clayton
and John Vidale.
Some years later when I knew more web programming I repaired the movie
which is here now.
Watch how the time axis advances from one frame to the next.
Watch how the frequency diminishes with time.
Watch how the angular bandwidth increases with time.
Here are the frames in the movie:
0
1
2
3
4
5
6
7
8
9
10
11
12
13
14
.
Here you have
my tape image (6Megs).
Here are the first 380 channels as floats.
16000x380.float (24 Megs).
I see the bit file is about 1/4 of the float file.
It should be 1/32 of it,
so there is more data that I haven't got to yet.
It's not a lot of fun decoding the tape.
You'll need to guess at the format.
Bob Clapp got me further along so I can present the frames here.
(For readers at Stanford,
everything is in our web server at ~jon/res/sam/ )
Reference
Sergey Fomel put this on
YouTube.
Here are some references provided by Simon Klemperer
1,
2.