

Next: Residual of three two-dimensional
Up: Three-dimensional prediction-error filter
Previous: Three-dimensional prediction-error filter
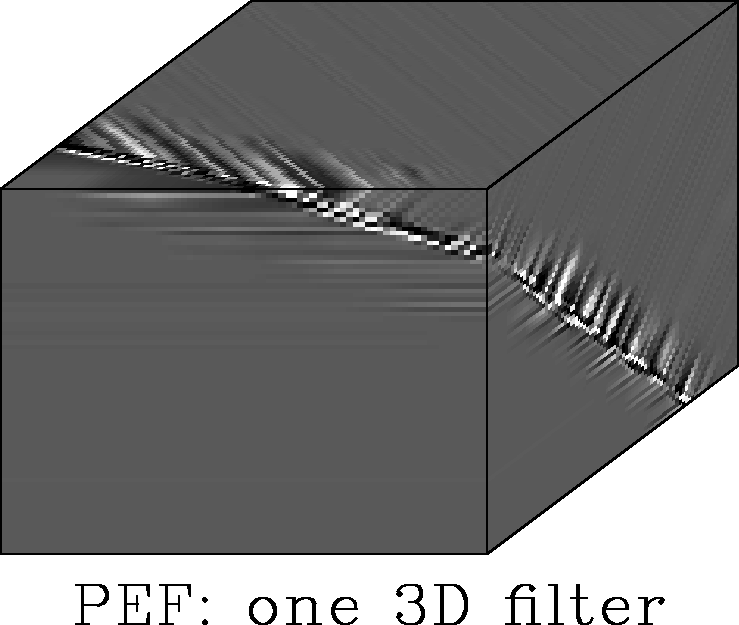
Figure 36 shows that
a single three-dimensional prediction-error filter
applied to the synthetic test image
suppresses the plane-wave events in the patches away
from the fault surface.
For patches that straddle the fault,
the prediction error is considerable.
In these nonstationary patches,
the prediction coefficients
are optimized to remove plane waves of two different dip simultaneously.
However, since the plane-wave events are not superimposed but adjacent,
the filter is unable to predict either event perfectly.
The unpredictable nature of neighboring amplitudes along the discontinuity
yields particularly high amplitudes.
The horizontal events tend to be better predicted
than the dipping events, probably due to
round-off errors.
zeroFolt1Pef3d
Figure 36
3-D prediction-error of synthetic image.
The three-dimensional prediction-error filter
predicts and removes the plane-wave events in patches undisturbed by
the discontinuity.
The patches that straddle the discontinuity are only partially removed.
|
|  |


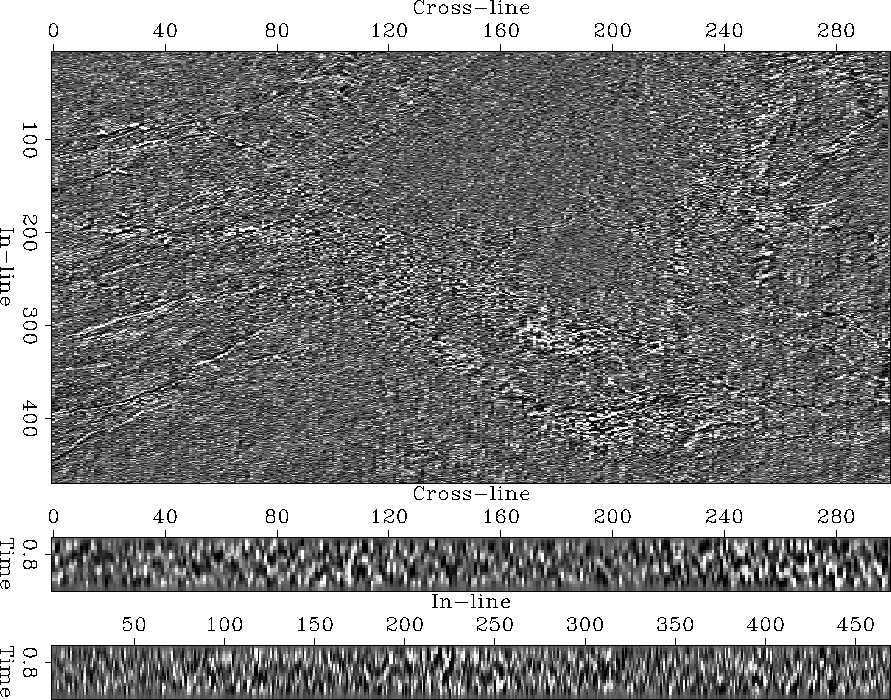
Figure 37 shows
the prediction-error attribute of the salt dome image.
The image's original wavefield character is completely suppressed.
The image indicates the faults,
but their exact location is obscured and interrupted by noise.
Due to the noise, the image lacks sharpness and contrast.
The detected faults are well resolved, but difficult to delineate.
In particular,
the fault marked R in the original image 8
is blurred at its fork.
The busy region at the southern tip of the salt body
hides the local faults.
Within the salt, the attribute barely hints at the pentagonoid region.
The salt itself is characterized by incoherent low amplitudes.
The salt boundary is a zone of increased noise level.
The boundary is diffuse and does not separate salt and adjacent sediments
authoritatively.
Overall, the attribute is too complex and noisy to benefit
geological interpretation.
gulfFoltTot1Pef3d
Figure 37
3-D prediction-error of salt image.
The attribute indicates the image's faults.
In many locations, however, the attribute's noise
obscures the fault features.


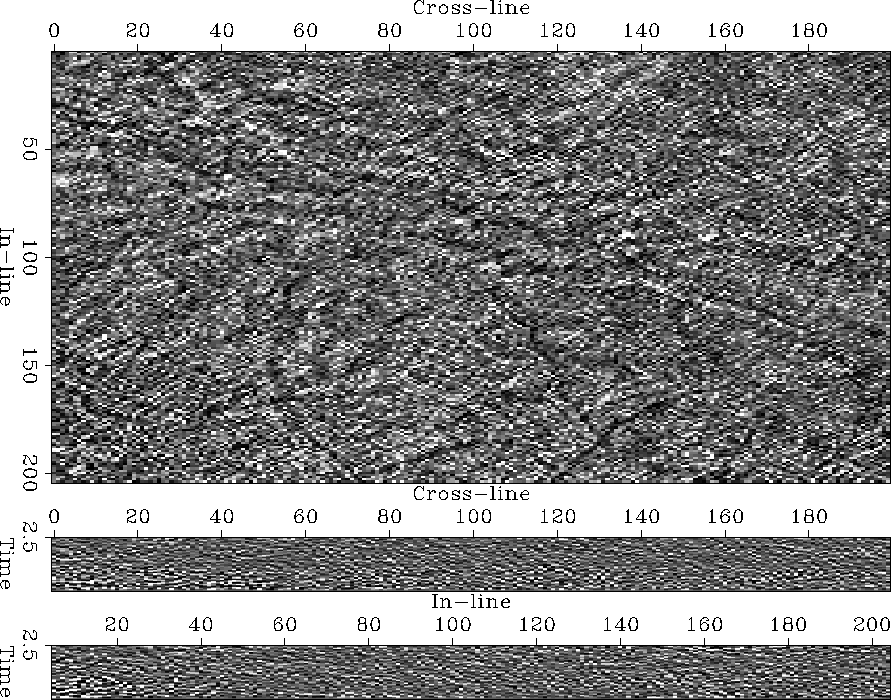
At a first impression,
the prediction error of
the North Sea horst image (Figure 38)
appears to be white noise.
Only careful inspection - especially at a grazing angle -
reveals the image's complex discontinuity pattern.
However, the faults are not easily delineated.
nseaFoltTot1Pef3d
Figure 38
3-D prediction-error of horst image.
Among the noise, a pattern of linear events
indicate the location of discontinuities to a careful observer.
Unfortunately, the attribute image lacks clarity.


Next: Residual of three two-dimensional
Up: Three-dimensional prediction-error filter
Previous: Three-dimensional prediction-error filter
Stanford Exploration Project
3/8/1999


