


One way to examine the difference between wave propagation in isotropic and VTI media is by observing snapshots of the wavefield generated by each medium. Figure 2 shows snapshots of the wavefield at 0.65 s and 1.3 s resulting from a source near the surface at lateral position 3000 m from the origin. The source location represents the first shot point of the original Marmousi data acquisition. This source is above a more anisotropic and less complex region of the VTI Marmousi model; an ideal setting for testing nonhyperbolic and tomographically based inversions for anisotropic media; both methods excel in smooth media.
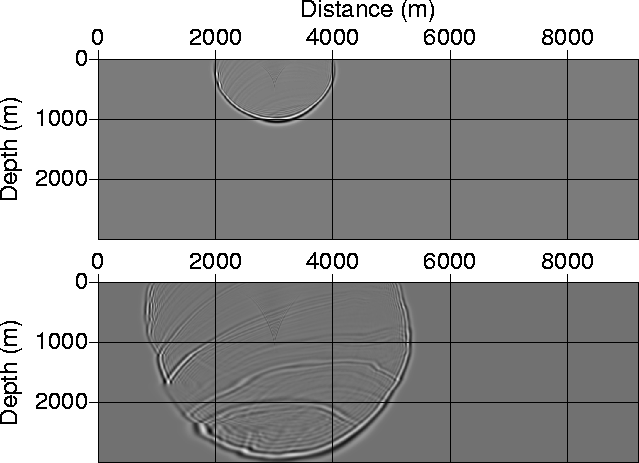 |

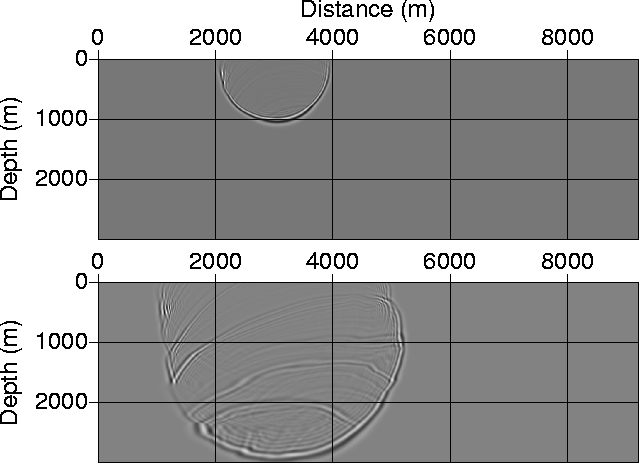
On the other hand, Figure 3 shows snapshots of the wavefield at 0.65 s and 1.3 s for the original isotropic Marmousi velocity model. Because the vertical velocity is the same for the anisotropic and isotropic Marmousi models, the portion of the wavefront corresponding to vertical wave propagation is similar, which we can see by subtracting the two wavefields, with results shown in Figure 4. As expected, the largest difference between the two wavefields occurs for near horizontal-direction wave propagation, where clear separation between the two fields are shown in Figure 4 in that direction. Careful observation of the difference section (Figure 4) shows that such separation is largest for waves propagating toward the origin (lower values of distance) because of the higher level of anisotropy in that region. Most energies recorded by the geophones arrive at incident angles closer to vertical than horizontal. Therefore, the large separation of energy in the horizontal direction of wave propagation in the two models is not a true indication of what to expect in the processing stage.
 |
 |
The synthetic data, discussed in the next section, should provide a better idea of what to expect in the processing stage.