Alkhalifah (1997a) showed images of the subsurface extracted by processing data from
offshore Angola (Africa) based on a VTI medium assumption.
He used a sequence of NMO, VTI DMO, and VTI zero-offset
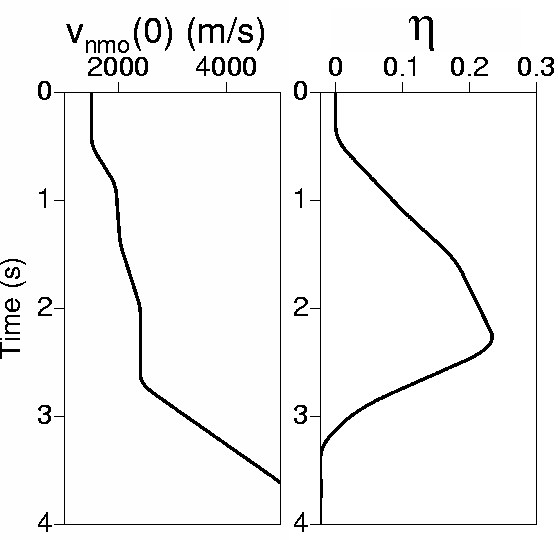
time migration to process the data. Figure 14 shows the inverted interval velocity and
![]() curves used in Alkhalifah's processing. The large
curves used in Alkhalifah's processing. The large ![]() value prior to 2.5 s correspond
to Tertiary shales, the main source of anisotropy in the subsurface (Banik, 1984; Sayer, 1995), as well
as in this data.
value prior to 2.5 s correspond
to Tertiary shales, the main source of anisotropy in the subsurface (Banik, 1984; Sayer, 1995), as well
as in this data.
 |
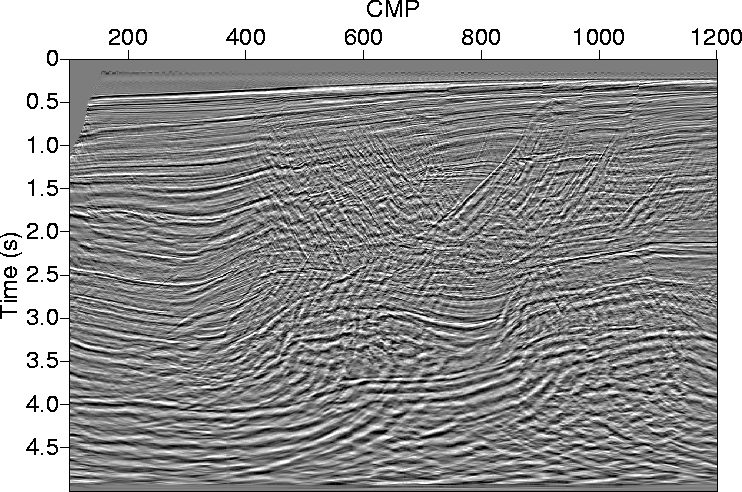
Here, I will apply prestack time migration to this data using the same inverted parameters in Figure 14. The prestack migration is followed by an inverse NMO with a single velocity, velocity analysis, and then an NMO with velocity extracted from the velocity analysis that may vary laterally, vertically, or both. The result of this new combination of processes resembles what I obtained in an earlier paper (Alkhalifah, 1997a), with improvements over the isotropic result very much intact (see Figure 15). Both the faults under CMP locations 400 and 900, between 2 and 2.5 s, which were not manifest in Alkhalifah's isotropic result, showed clearly here.
 |
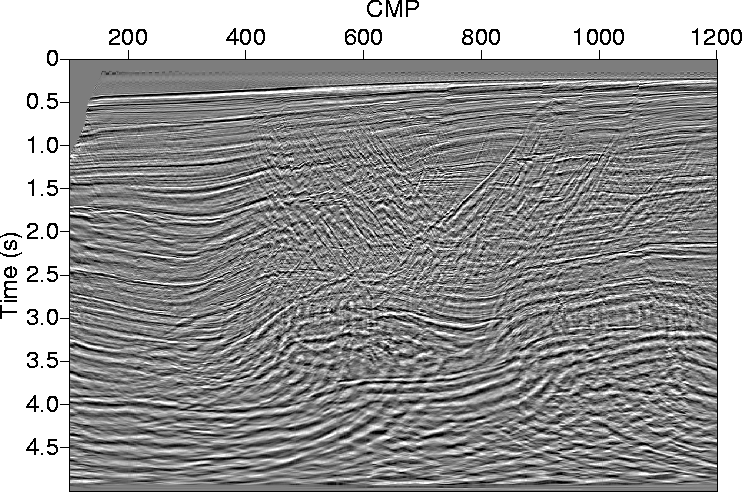
Figure 16 shows the result of using the interval NMO velocities in Figure 14 in an isotropic prestack phase-shift migration. The run time for the two migrations (the isotropic and anisotropic one) is practically the same. Yet the anisotropic result is far superior to the isotropic one, especially in focusing the dipping faults. Alkhalifah (1997) arrived at this same conclusion using the poststack processing sequence.
 |
The overall cost, however, of the DMO-based processing is slightly lower than that of prestack phase-shift migration. However, if sharper velocity models are used, the cost of the phase-shift prestack approach will be considerably lower if comparable quality results is the goal. For DMO, increased dip sampling is needed to handle sharper velocity models, and such an increase in dip sampling will influence the speed of the migration negatively.
There are two major numerical differences between the poststack approach which features the dip-decomposition DMO (Alkhalifah, 1996) and the prestack approach described here. First, in the prestack phase-shift method the corrections (NMO, DMO, and zero-offset migration) are all applied to the data in the Fourier domain, where the slopes of the reflection are not yet zero-offset. Such an implementation requires, as we have seen earlier, solving for one unknown parameter (ph) in order to apply the phase shift in a v(z) model. In contrast, the dip-decomposition DMO requires solving for four unknowns (Artley and Hale, 1994) to handle (within the limit of ray theory) a v(z) model exactly. The large number of unknowns in the DMO approach introduces instability problems in its implementation, especially in handling a complex v(z) model. Working with plane waves, as is the case in the phase-shift method, typically yields much simpler equations than working with point-source waves.
A second difference corresponds to the dip-decomposition approach in which, unless the dip sampling is fine enough, artifacts can occur in the DMO result. Again, this is a problem when sharper velocity models are considered.