


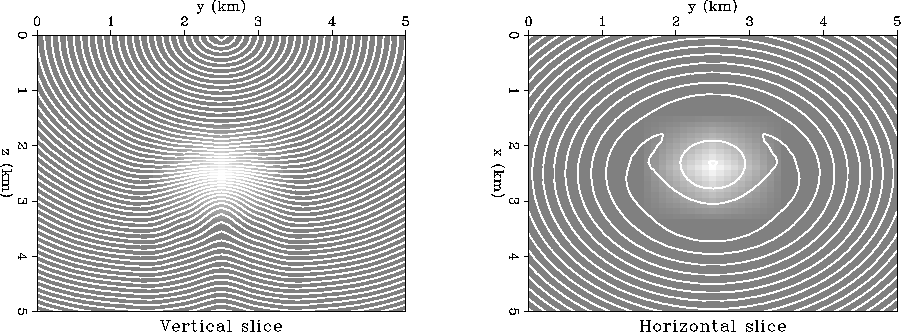
For the first numerical test, I used a model with a smooth anomaly inside a constant slowness background. The initial traveltime was computed analytically, using the background slowness. The result of the computation is shown in Figure 1. The computation involved 3 re-linearization cycles with 10 linear inversion iterations in each cycle.
 |


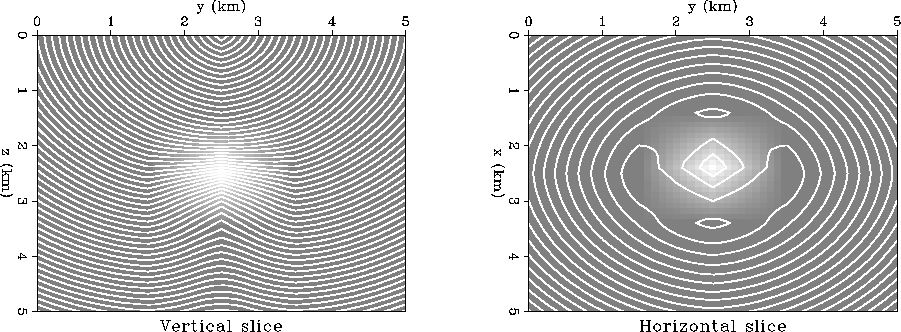 |
The result shows the expected behavior of the wavefronts. It agrees with the result of a direct eikonal computation, shown in Figure 2. The direct computation was done with Mihai Popovici's TTGES eikonal solver, which has outstanding efficiency and stability properties. Obviously, more tests are required to evaluate the comparative performance of the algorithm and the limits of its practical applicability. The discussion section contains some speculations about the perspective usage of the linearized algorithm.