Thomsen's parameter ![]() is defined by
is defined by
= (f+l)^2 - (c-l)^22c(c-l).
This parameter is considerably more difficult to analyze than either
![]() or
or ![]() for various reasons, some of which we will
enumerate shortly.
for various reasons, some of which we will
enumerate shortly.
Because of the controversy surrounding the sign of ![]() for
finely layered media, we have performed a series of Monte Carlo
simulations with the purpose of establishing the existence or
nonexistence of layered models having positive
for
finely layered media, we have performed a series of Monte Carlo
simulations with the purpose of establishing the existence or
nonexistence of layered models having positive ![]() .The simulations to be presented here were performed on
models limited to two types of layers. Another set of
simulations was performed having three types of layers, since
it is known (Backus, 1962) that this is the most general case that
needs to be considered, but we will not present that work here.
The set of constant density models was chosen randomly by specifying
the possible values of vp to lie in some range
.The simulations to be presented here were performed on
models limited to two types of layers. Another set of
simulations was performed having three types of layers, since
it is known (Backus, 1962) that this is the most general case that
needs to be considered, but we will not present that work here.
The set of constant density models was chosen randomly by specifying
the possible values of vp to lie in some range
![]() . The values chosen for the limiting
wave speeds in the example shown in Figures 1 and 2 were
vpmin = 2.5 km/sec and vpmax = 5.5 km/sec.
The range of the shear wave velocity was similarly specified
by constraining the ratio vs/vp to lie within a range
. The values chosen for the limiting
wave speeds in the example shown in Figures 1 and 2 were
vpmin = 2.5 km/sec and vpmax = 5.5 km/sec.
The range of the shear wave velocity was similarly specified
by constraining the ratio vs/vp to lie within a range
![]() , where for the case being presented
rmin = 0.35 and rmax = 0.65. The density was chosen
to be
, where for the case being presented
rmin = 0.35 and rmax = 0.65. The density was chosen
to be ![]() kg/m3, but any choice of constant density would have
resulted in the same dimensionless Thomsen parameters.
For comparison, note that the density of quartz is about 2650 kg/m3
and the density of calcite is about 2720 kg/m3 (e.g.,
Wilkens et al., 1984).
kg/m3, but any choice of constant density would have
resulted in the same dimensionless Thomsen parameters.
For comparison, note that the density of quartz is about 2650 kg/m3
and the density of calcite is about 2720 kg/m3 (e.g.,
Wilkens et al., 1984).
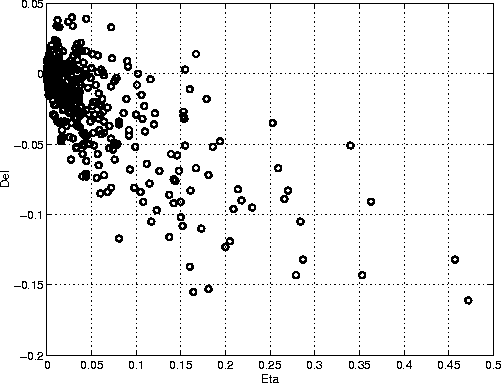
Figure 1 shows the Monte Carlo results for
![]() plotted versus
plotted versus ![]() from 500 random models, where
from 500 random models, where
= -1 + 2.
The parameter ![]() has been shown to be useful in
seismic processing by
Alkhalifah and Tsvankin (1995).
It is particularly useful in the present context because it is
known that for layered media this parameter will always be
positive because
has been shown to be useful in
seismic processing by
Alkhalifah and Tsvankin (1995).
It is particularly useful in the present context because it is
known that for layered media this parameter will always be
positive because ![]() will always be positive
(Postma, 1955; Backus, 1962; Berryman, 1979).
We see that most models are clustered around the origin
will always be positive
(Postma, 1955; Backus, 1962; Berryman, 1979).
We see that most models are clustered around the origin
![]() , but there is no question that
a large fraction of the models have positive
, but there is no question that
a large fraction of the models have positive ![]() .For this particular method of generating the models,
we find that about 25% of the two-layer models have positive
.For this particular method of generating the models,
we find that about 25% of the two-layer models have positive ![]() .
.
 |
Encouraged by the Monte Carlo simulation results, we have
analyzed ![]() in light of the Backus formulas in order to determine
whether it was possible to understand those circumstances in which
in light of the Backus formulas in order to determine
whether it was possible to understand those circumstances in which
![]() are most likely to occur.
Using the formulas (avea)-(avem)
derived by Backus (1962), it is not hard to show
that one natural form of the expression for
are most likely to occur.
Using the formulas (avea)-(avem)
derived by Backus (1962), it is not hard to show
that one natural form of the expression for ![]() is
is
=
2<++2>
<+(+2)>^-1
[<1>
<++2>
-<+(+2)>].
It is easy to show that the prefactors are all always positive.
So the sign of ![]() is determined by the expression in brackets.
Using simple algebraic manipulations, this expression can be rewritten
in a number of different but useful forms, including
is determined by the expression in brackets.
Using simple algebraic manipulations, this expression can be rewritten
in a number of different but useful forms, including
<1>
<++2>
-<+(+2)> =
<1+2>
<+2>
- <(+2)>
<+2> = <1+2>
<++2>
- <+(+2)>
<+2> = <1+2>
- <1>
<+2>.
The manipulations required to arrive at these results will be
described in more detail elsewhere.
The important point about this sequence of equalities is that
each successive one can be used to prove something general about
the sign of ![]() for layered media. In each case, we note that
if some multiplicative factor is constant in all layers of the finely layered
medium, then that factor may be removed from the averages.
Using this technique, the first transformation
shows that if
for layered media. In each case, we note that
if some multiplicative factor is constant in all layers of the finely layered
medium, then that factor may be removed from the averages.
Using this technique, the first transformation
shows that if ![]() , then the expression and therefore
, then the expression and therefore
![]() is nonpositive. Similarly, the second equality in the
sequence shows that if
is nonpositive. Similarly, the second equality in the
sequence shows that if ![]() , then
, then ![]() is also
nonpositive. The third equality shows that if
is also
nonpositive. The third equality shows that if ![]() ,then again
,then again ![]() is nonpositive. The very first
expression may also be used in a slightly different way to
arrive at a general result,
is nonpositive. The very first
expression may also be used in a slightly different way to
arrive at a general result, ![]() if Poisson's ratio
is constant (Thomsen, 1986), for in that case the ratio
if Poisson's ratio
is constant (Thomsen, 1986), for in that case the ratio ![]() is also constant
and so
is also constant
and so ![]() is constant.
is constant.
It is straightforward to show for layered media having only two
constituents that the last expression in (variousforms)
implies that ![]() will be positive if
will be positive if
_1_2 < _1_2 < 1,
showing that the fluctuations in the ![]() Lamé constant
must be greater than those in the shear modulus
Lamé constant
must be greater than those in the shear modulus ![]() to observe
positive
to observe
positive ![]() .
.
As discussed earlier, vs/vp ratios are
decreased by the presence of pores, flat cracks,
or the addition of clay, dolomite, feldspar, or
calcite to silicic rocks. Any of these factors can
cause fluctuations in ![]() without greatly changing
without greatly changing ![]() .
.
For layered media with constant density, the final expression in (variousforms) shows that
sign() = sign(<v_p^-2> - <v_s^-2> <v_s^2/v_p^2>).
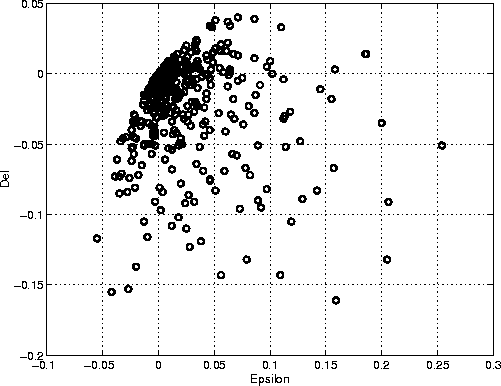
Because our analysis establishes a similarity in the circumstances
between the occurrence of positive ![]() and the occurrence of
small positive or negative
and the occurrence of
small positive or negative ![]() (i.e., both
occur when Lamé
(i.e., both
occur when Lamé ![]() is fluctuating greatly from layer to
layer), we have plotted
is fluctuating greatly from layer to
layer), we have plotted ![]() versus
versus ![]() in Figure 2.
The Monte Carlo results
used to produce Figure 2 are exactly the same as those used to produce
Figure 1. We see that, as expected from the analysis, the positive
values of
in Figure 2.
The Monte Carlo results
used to produce Figure 2 are exactly the same as those used to produce
Figure 1. We see that, as expected from the analysis, the positive
values of ![]() are in fact most highly correlated with the
small but positive values of
are in fact most highly correlated with the
small but positive values of ![]() . We should also keep
in mind the fact that
. We should also keep
in mind the fact that ![]() is always true
for layered models and this fact also plays a role in Figure 2,
determining the unoccupied upper left hand corner.
is always true
for layered models and this fact also plays a role in Figure 2,
determining the unoccupied upper left hand corner.
 |