


|
complete
Figure 4 Synthetic seismogram generated from well log | 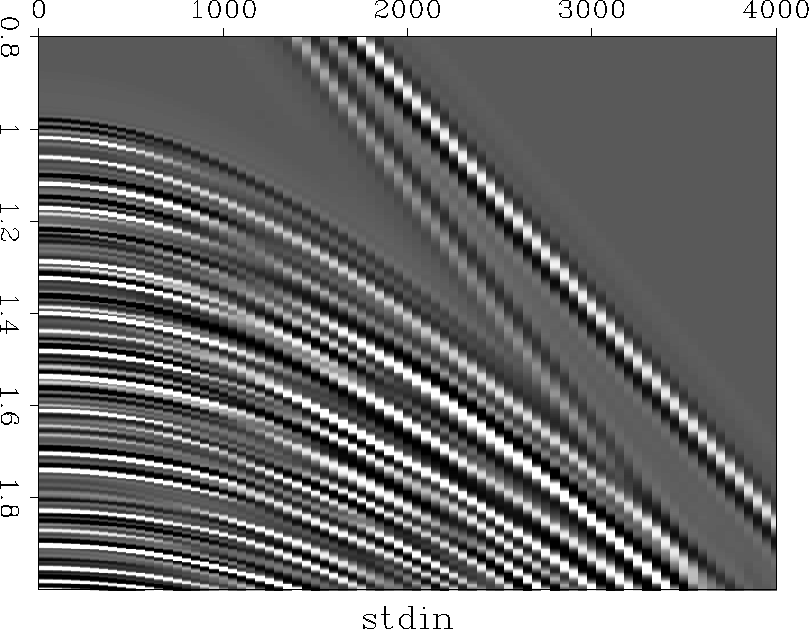 |


An image of the AVO response of the entire data set is shown in Figure 4. It was generated by the Haskell reflectivity method. The systematic study of AVO with depth was done by fitting P-wave velocity, S-wave velocity and density to straight lines separately for sand and shale, thus establishing a trend for each of the variables. A two-layer earth model was then created by choosing several depths and picking the Vp, Vs and the density for both the shale and the sand trends. The top layer was shale and the bottom layer was sand. The sand was assumed to be saturated with water.