


In this section we explore the effect of layering on the inversion using
vertical and radial particle velocity. As in the previous section, we first
used all the data to examine the full impact of the layering on the
data (case 1). Subsequently, we used only the near offsets (case 2) in an
attempt to reduce the layering effect. The inversion results are shown in
Table 6.
| case | vp2 (m/s) | vs2 (m/s) |
| 1 | 2115 + 24.9% / 2125 + 25.5% | 315 - 27.9%/ 287 34.3% |
| 2 | 1660 - 1.9% / 1604 - 2.1% | 411 - 5.9% / 464 + 6.2% |
The inversion results show that when we use the data only as long as the subsurface structure effects are small (case 2), the P-wave and S-wave velocities are within reasonable error bounds. It can also be noted that when all data are used, the inverted P-wave velocity is very close to the velocity of the second layer. It converges to the velocity of the first layer when the large offset data are neglected.
Figure 20 shows the AVO coefficient for 100 m layering and the inverted AVO curve. Figure 21 displays the same for 50 m layering. In both cases, the AVO coefficient contains significant scattering at angles where the seismic signals from the seafloor and the second layer interfere. Furthermore, the angle at which the AVO coefficient reaches its minimum value of 0 and the critical angle have been shifted (compare with Figure 8).
The inverted AVO curves are compared with the theoretical ones in Figures 22 and 23. It is obvious how well the AVO curves agree both for 100 m layering and 50 m layering when only the near offset data were used.
|
vzxlavo
Figure 20 The AVO coefficient calculated from all Vz-Vr data in the case of 100 m layering is represented by +. The inverted AVO curve is overlain. |  |

|
vzxl50avo
Figure 21 The AVO coefficient calculated from all Vz-Vr data in the case of 50 m layering is represented by +. The inverted AVO curve is overlain. | 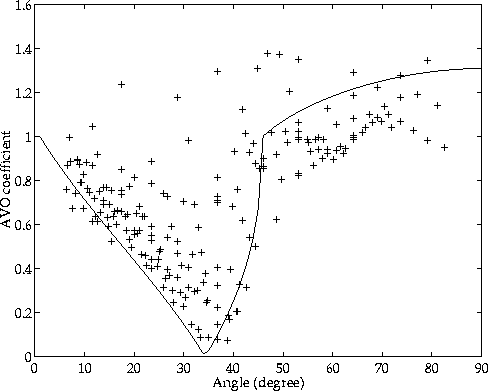 |
|
100xavo
Figure 22 Comparison of the two inverted AVO curves with the exact one in the case of 100 m layering. | 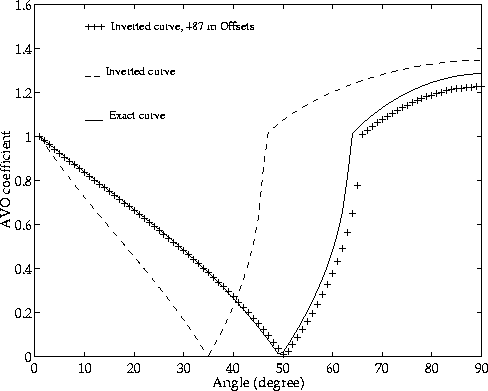 |
|
50xavo
Figure 23 Comparison of the two inverted AVO curves with the exact one in the case of 50 m layering. |  |
In contrast to the P-Vz method, the Vz-Vx method yields reasonable seafloor parameters when only the near-offset data are used. It seems to be more stable and robust in the case of layering and it affects the inversion less. The use of a very hard second layer simulates the extreme case of layering. If the properties of the layer are closer to the near sea-bottom ones, the inversion should yield more constrained parameters with fewer errors. It might also be interesting to examine the effect when interference from more than one layer occurs.