In this section, we evaluate the effect that layering has on the
inversion by means of
pressure and vertical particle velocity data.
We explored the inversion for the near ocean-bottom parameters in three
different ways. First we used the muted data without any changes or constraints
to examine the full impact of the layering (case 1). Then we tried
to remove the effect
of the second layer by using only the first 362 m in offset (case 2).
Since the seafloor is at a shallow depth of 120 m, these offsets still
allow for an angle coverage above critical angle. Subsequently,
we used all offsets again in the data transformation but constrained
the inversion by assuming an a priori determined P-wave velocity and by
restricting the maximum angle of incidence used in the inversion to 30![]() - 35
- 35![]() (case 3). The P-wave velocity was set to 1650 m/s which
includes an error of 2.5%.
(case 3). The P-wave velocity was set to 1650 m/s which
includes an error of 2.5%.
The near sea-floor parameters resulting from the inversion and their error bounds are listed in Table 5.
| case | vp2 (m/s) | vs2 (m/s) |
| 1 | 1867 + 10.3% / 1912 + 12.9% | 483 + 10.5% / 557 +27.5% |
| 2 | 1742 + 2.9% / 1526 - 9.9% | 846 + 93.6% / 373 - 14.6% |
| 3 | 1650 - 2.5% / 1650 - 2.5% | 338 - 22.7%/ 341 - 22% |
| case | |
| 1 | 1814 - 4.5% / 1849 - 2.7% |
| 2 | 2228 + 17.3% / 2359 + 24.5% |
| 3 | 1970 + 3.7% / 1939 + 2.1% |
From the data values alone, it is obvious that the 100 m layering
affects the inversion less than the 50 m layering when all data were used
(case 1).
In both layering cases (100 m and 50 m),
the inverted seafloor parameters deviate significantly
from the real ones. Using only the near offset data (case 2), we see that
the P-wave velocities
become more constrained, while the densities become less well constrained.
The inverted S-wave velocity shows more than 90% error for the 100 m
layering.
In the case of a priori P-wave velocity information and a constraining of
the inversion
to angles less than 35![]() degrees, both the inversion of the data for
100 m layering and for 50 m layering
show comparable results.
degrees, both the inversion of the data for
100 m layering and for 50 m layering
show comparable results.
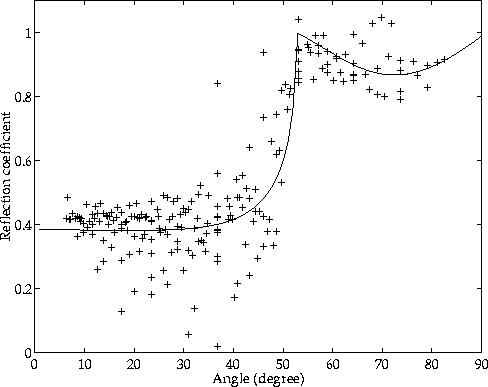
Figure 16 displays the reflection coefficient and the inverted
AVO curve for the 100 m layering in the case in which all data
were used. By comparison,
Figure 17 shows the same for 50 m layering. It is obvious that
in both cases the calculated reflection coefficient displays considerably more
scattering than that without layering effects (see Figure 7). For
100 m layering, the data are significantly affected at angles above
35![]() . The 50 m layering introduces scattering at smaller angles.
In both cases,
the critical angle information seems to have been shifted to smaller angles.
The scattering occurs at angles at which the seismic signals interfere.
. The 50 m layering introduces scattering at smaller angles.
In both cases,
the critical angle information seems to have been shifted to smaller angles.
The scattering occurs at angles at which the seismic signals interfere.
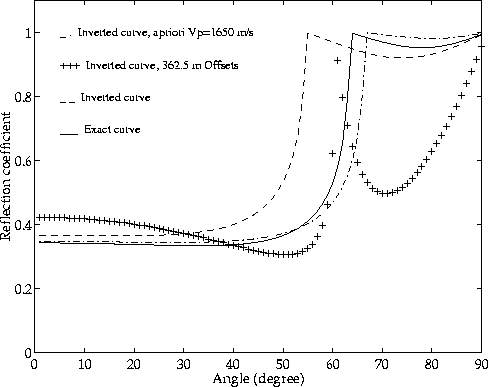
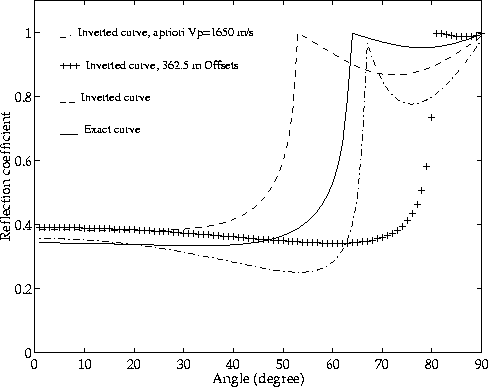
Figures 18 and 19 compare the AVO curves for all three inversion cases with the theoretical one. The constrained inversion results in the best fit, since both the errors in the P-wave velocity and density are rather small. The S-wave velocity was determined best when all the data was used (case 1). In that case, however, P-wave velocity and density deviated too much. For 50 m layering, none of the inverted AVO curves matches the theoretical very well. The best fit was probably achieved by the constrained inversion (case 3).
|
vzplavo
Figure 16 The reflection coefficient calculated from all P-Vz data in the case of 100 m layering is represented by +. The inverted AVO curve is overlain. |  |
|
vzpl50avo
Figure 17 The reflection coefficient calculated from all P-Vz data in the case of 50 m layering is represented by +. The inverted AVO curve is overlain. |  |
|
100avo
Figure 18 Comparison of the three inverted AVO curves with the exact one in the case of 100 m layering. |  |
|
50avo
Figure 19 Comparison of the three inverted AVO curves with the exact one in the case of 50 m layering. |  |