


We explored the utility of pressure and vertical particle
components recorded directly on the ocean-bottom for the determination
of the near seafloor properties. The direct wave and primary reflected
signals
are transformed into the (![]() ) domain and the reflection coefficient is
obtained by spectral division.
Inverting the result for density, P-wave and S-wave velocity yields:
) domain and the reflection coefficient is
obtained by spectral division.
Inverting the result for density, P-wave and S-wave velocity yields:
vp2 = 1690 m/s, vs2 = 487 m/s, and ![]() 1951 kg/m3.
1951 kg/m3.
These results can be compared with those used for generating the model
(Table 1).
While there is only a 3 m/s discrepancy in the P-wave velocity, the S-wave velocity
is off by about 50 m/s (![]() error), and the density by 51 kg/m3
(
error), and the density by 51 kg/m3
(![]() error).
The amplitude spectrum of the reflection coefficient obtained from the
data in the (
error).
The amplitude spectrum of the reflection coefficient obtained from the
data in the (![]() ) domain is overlain by the AVO curve calculated from the inversion results and shown in Figure 6.
The fit is reasonably good.
Figure 7, which displays
the theoretical AVO curve and the inverted one, shows these curves to be
in good agreement.
The largest discrepancy occurs at the post-critical angles, which is caused
by the fact that the highest error in the inverted parameters is in the
S-wave velocity.
) domain is overlain by the AVO curve calculated from the inversion results and shown in Figure 6.
The fit is reasonably good.
Figure 7, which displays
the theoretical AVO curve and the inverted one, shows these curves to be
in good agreement.
The largest discrepancy occurs at the post-critical angles, which is caused
by the fact that the highest error in the inverted parameters is in the
S-wave velocity.
The deviation of real and inverted S-wave velocity results from the scatter in the reflection coefficient. Less information is available for the post-critical reflections, thus causing a larger spread of the reflection coefficient in that region. Furthermore, aperture effects in the Hankel transform, and division by higher frequency vibrations in the data might introduce additional scattering effects. Constraining the inversion by prior information might improve the result, as only two parameters would have to be inverted for.
Next we explored the robustness of the parameter inversion by using less
angular information in the inversion. For different maximum angles of
incidence,
the inversion yields the following results which are listed in Table 2.
| Angle ( |
vp2 (m/s) | vs2 (m/s) | |
| 84 | 1690 - 0.2% | 487 + 11.4% | 1951 + 2.7% |
| 60 | 1707 + 0.8% | 504 + 15.3% | 1916 + 0.8% |
| 50 | 1673 - 1.2% | 453 + 4.7% | 1948 + 2.5% |
| 40 | 1633 - 3.5% | 417 - 4.6% | 1994 + 5.0% |
|
vzp
Figure 6 The calculated reflection coefficient from the P-Vz data is represented by +. It is overlain by the AVO curve based on the inverted values. | 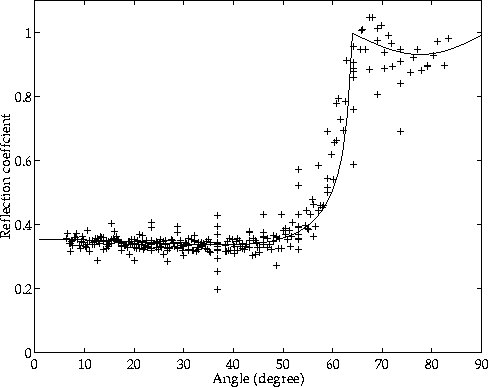 |

|
vzpavo
Figure 7 Theoretical AVO curve (solid line) versus inverted curve (dotted line). | 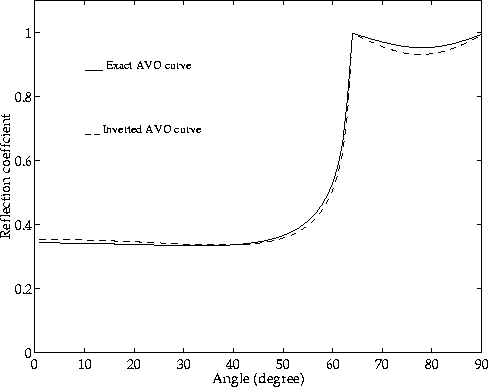 |
The P-wave and S-wave velocities are estimated with reasonable accuracy for all angles, but the density becomes slightly less well determined with decreasing angles. Even though the sensitivity analysis indicated that most shear wave information is contained in the post-critical reflections, well-constrained data will give good estimates for lower angles. For real data, this method is complicated by the fact that the pressure recording and the vertical particle velocity component have to be calibrated for comparison of the amplitude information.