

Next: Migration results
Up: COMMON-AZIMUTH DEPTH MIGRATION TEST
Previous: Migration algorithms
The data set used for the tests was recorded in the southern
sector of the North Sea.
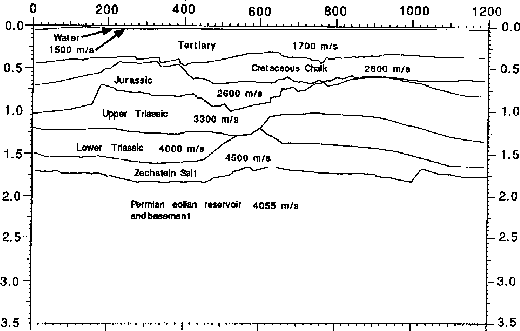
A typical in-line geological section of the area
is shown in Figure ![[*]](http://sepwww.stanford.edu/latex2html/cross_ref_motif.gif) .
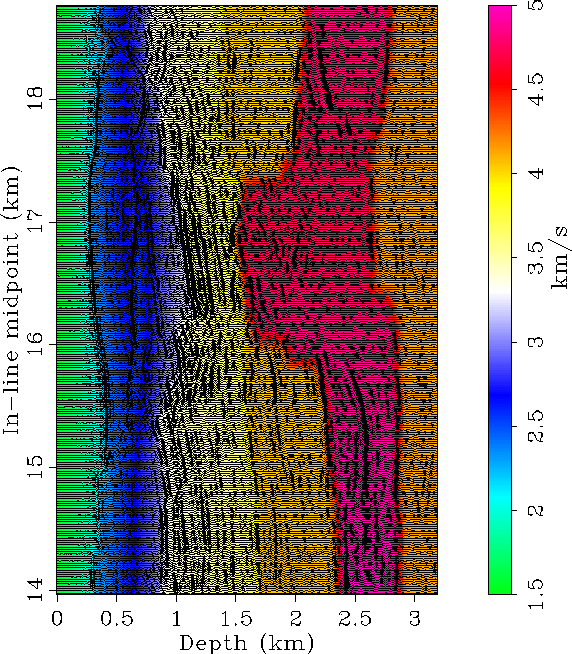
An in-line section showing the velocity model
superimposed onto a wiggle plot of the migrated image
is shown in Figure
.
An in-line section showing the velocity model
superimposed onto a wiggle plot of the migrated image
is shown in Figure ![[*]](http://sepwww.stanford.edu/latex2html/cross_ref_motif.gif) .
The geological section indicates shallow velocity variations
created by variable thickness
in the low-velocity Tertiary sediments and
in a high-velocity Cretaceous chalk layer.
The reflections from the complex three-dimensional faulting in the
Jurassic and Triassic formations just above the salt swell
are affected by these shallow
velocity variations.
The exploration targets are the reflectors
immediately below the salt.
The correct positioning and the full
focusing of the reflections from the target
require prestack depth migration.
McKay and Abma 1992
used a 2-D data set
recorded above a similar geological setting to test their
depth-focusing velocity analysis methodology;
they provide a detailed description of the geological
setting and its effects on depth imaging.
.
The geological section indicates shallow velocity variations
created by variable thickness
in the low-velocity Tertiary sediments and
in a high-velocity Cretaceous chalk layer.
The reflections from the complex three-dimensional faulting in the
Jurassic and Triassic formations just above the salt swell
are affected by these shallow
velocity variations.
The exploration targets are the reflectors
immediately below the salt.
The correct positioning and the full
focusing of the reflections from the target
require prestack depth migration.
McKay and Abma 1992
used a 2-D data set
recorded above a similar geological setting to test their
depth-focusing velocity analysis methodology;
they provide a detailed description of the geological
setting and its effects on depth imaging.
Although the geology in the area has predominant dips
in the in-line direction,
there are few interesting 3-D effects that require full 3-D migration
to be properly taken into account.
The fault blocks and the lithological boundaries
in the Jurassic and Triassic layers are rotated with
respect to the in-line direction, generating reflections
with uneven azimuth.
Both the top of the salt and the dolomite intrusions
have complex reflector geometry that require 3-D migration.
Further, because of the 3-D nature of the velocity model,
full 3-D depth migration is needed to properly
image the mildly dipping reflectors at the bottom of the salt layer.
geoltr
Figure 1
Geological in-line section and corresponding velocities of layers.
From (Hanson and Witney, 1995).

veldata19800
Figure 2 Migrated section superimposed to velocity model (CMP Y=19.8 km)


The data were acquired using a flip-flop
double-source and triple streamer acquisition configuration
and affected by cable feather.
Therefore, the original data geometry is not exactly common-azimuth
and the data need to be transformed to
a regularly sampled ``equivalent'' common-azimuth data set
before migration.
The transformed data set had the same sampling of
the nominal sampling of the acquisition;
that is, 9.75 m in the in-line direction,
and 25 m in the cross-line direction.
The offset axis was sampled with a 80 m interval;
this coarse sampling introduced some aliasing along
the offset axis, which seems to have
caused only minor artifacts in the migration.
I used this coarse sampling to reduce the migration
computation time,
and limit the size of the data set
that needed to be handled.
Tests with finer sampling of the offset axis are needed
to determine more reliably the impact of offset aliasing on the
results.
To fully take into account the deviations of the source-receiver
azimuth from the nominal common azimuth,
AMO Biondi et al. (1996b) should be applied to
compute the common-azimuth data.
But, for this initial test I used a simple horizontal
binning and interpolation procedure
that placed the traces at the correct midpoint,
and normalized the interpolated output by the bin fold.
The coarse sampling of the output
offset axis implied some offset mixing,
thus I applied NMO before the binning-interpolation
procedure,
and applied inverse NMO afterward.
Both the stacking velocity function used for NMO and inverse NMO,
and the interval velocity function used for migration were
provided by Conoco.
The interval velocity model was derived by a tomographic
procedure that used a 3-D migrated volume to define lithological
boundaries
Hanson and Witney (1995).
The velocity model can thus be used as an indirect
check of the geometric correctness of the migrated images;
that is, that common-azimuth migration correctly positions in depth
the reflectors.
The velocity model was the same for both the 3-D
and the multi-line 2-D migration.
In both cases I used five reference velocities in the PSPI algorithm.
Preliminary tests showed that,
if only three reference velocities were used in the PSPI algorithm,
migration would poorly focus the reflectors.
Possibly, it would be beneficial to increase the number of
reference velocities even further; more tests in this direction are needed.
For downward continuation, the interval velocity was linearly interpolated
to the dense sampling of the image (8 m depth, 9.75 m in-line, 25 m cross-line)
from a sparser grid (40 m depth, 187.5 m in-line, 200 m cross-line).
No smoothing was applied to the interpolated velocity.


Next: Migration results
Up: COMMON-AZIMUTH DEPTH MIGRATION TEST
Previous: Migration algorithms
Stanford Exploration Project
11/11/1997
![[*]](http://sepwww.stanford.edu/latex2html/cross_ref_motif.gif) .
An in-line section showing the velocity model
superimposed onto a wiggle plot of the migrated image
is shown in Figure
.
An in-line section showing the velocity model
superimposed onto a wiggle plot of the migrated image
is shown in Figure ![[*]](http://sepwww.stanford.edu/latex2html/cross_ref_motif.gif) .
The geological section indicates shallow velocity variations
created by variable thickness
in the low-velocity Tertiary sediments and
in a high-velocity Cretaceous chalk layer.
The reflections from the complex three-dimensional faulting in the
Jurassic and Triassic formations just above the salt swell
are affected by these shallow
velocity variations.
The exploration targets are the reflectors
immediately below the salt.
The correct positioning and the full
focusing of the reflections from the target
require prestack depth migration.
McKay and Abma 1992
used a 2-D data set
recorded above a similar geological setting to test their
depth-focusing velocity analysis methodology;
they provide a detailed description of the geological
setting and its effects on depth imaging.
.
The geological section indicates shallow velocity variations
created by variable thickness
in the low-velocity Tertiary sediments and
in a high-velocity Cretaceous chalk layer.
The reflections from the complex three-dimensional faulting in the
Jurassic and Triassic formations just above the salt swell
are affected by these shallow
velocity variations.
The exploration targets are the reflectors
immediately below the salt.
The correct positioning and the full
focusing of the reflections from the target
require prestack depth migration.
McKay and Abma 1992
used a 2-D data set
recorded above a similar geological setting to test their
depth-focusing velocity analysis methodology;
they provide a detailed description of the geological
setting and its effects on depth imaging.

