

Next: CONCLUSIONS
Up: Rickett, Biondi & Lumley:
Previous: COMPARISON WITH ZOEPPRITZ
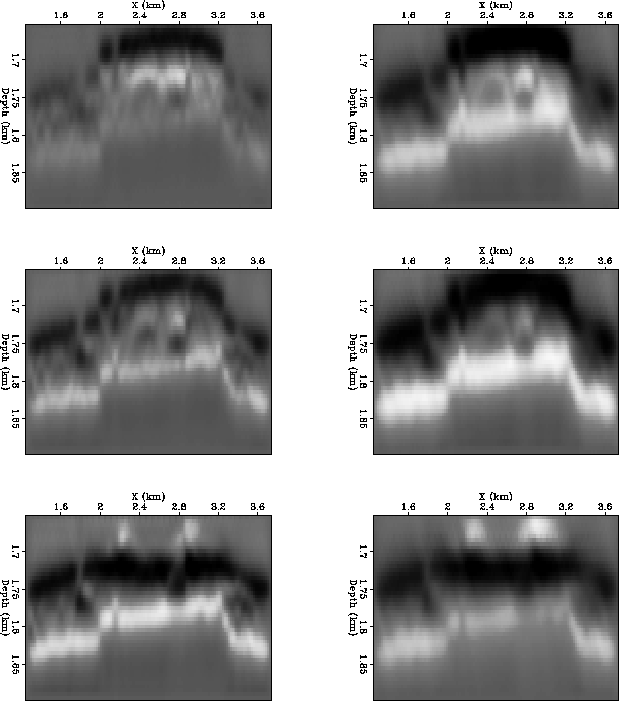
Depth migration results from Biondi et al. 1996
are shown in Figure 3. These correspond to an in-line slice
through the model at Y=2.27 km, which intersects two water injection
wells.
The left panels are zero-offset and the
right panels have a source-receiver offset of 3000 m. The top row corresponds
to t=0, the middle row corresponds to t=3 years and the bottom row is the
difference between the two.
At t=0, a gas cap extends from the top of the reservoir to approximately
1.72 km depth. After three years, the water injectors cause the gas cap to be
unevenly depleted. This effect is clearly visible in the difference sections.
results
Figure 3
Migrated synthetic seismograms from a heterogeneous reservoir model.
The left panels are zero-offset and the
right panels have a source-receiver offset of 3000 m. The top row corresponds
to t=0, the middle row corresponds to t=3 years and the bottom row is the
difference between the two.

With the insight gained from the plane layer studies above, meaningful,
but qualitative, comparisons between the two offsets can be made. The gain
applied to the results from both zero- and far-offset
surveys was the same, enabling direct comparisons be made between the two.
The clearest differences between the surveys at different offsets
are that the large-offset sections
have lower resolution, but larger amplitudes than the zero-offset sections.
The decrease in resolution is an inherent effect of the migration operator.
The increase in amplitudes is due to the fact that the reservoir
is mostly oil/gas saturated, and the previous results show that the
reflection coeffiecient for both the oil-sands and the gas-sands
increase with offset.
The most noticable difference between the two `difference' seismograms,
is that the change in amplitude due to the water injection and
disappearance of the gas cap is much larger at large offset than in the
near-offset sesctions. This highlights the result from the plane
layer-modeling that the large-offset section
is most sensitive to the presence of gas.
Other differences between the two offsets are harder to
interpret; although an `AVO cube' may help this process.
This shows some of the difficulties in drawing conclusions from
variation in amplitude with offset. Heterogeneities in the
subsurface are imaged with different resolution for different offset,
and even with the simple lithologies that we have created, it is difficult
to identify the source of anomalies.


Next: CONCLUSIONS
Up: Rickett, Biondi & Lumley:
Previous: COMPARISON WITH ZOEPPRITZ
Stanford Exploration Project
11/12/1997
