 |
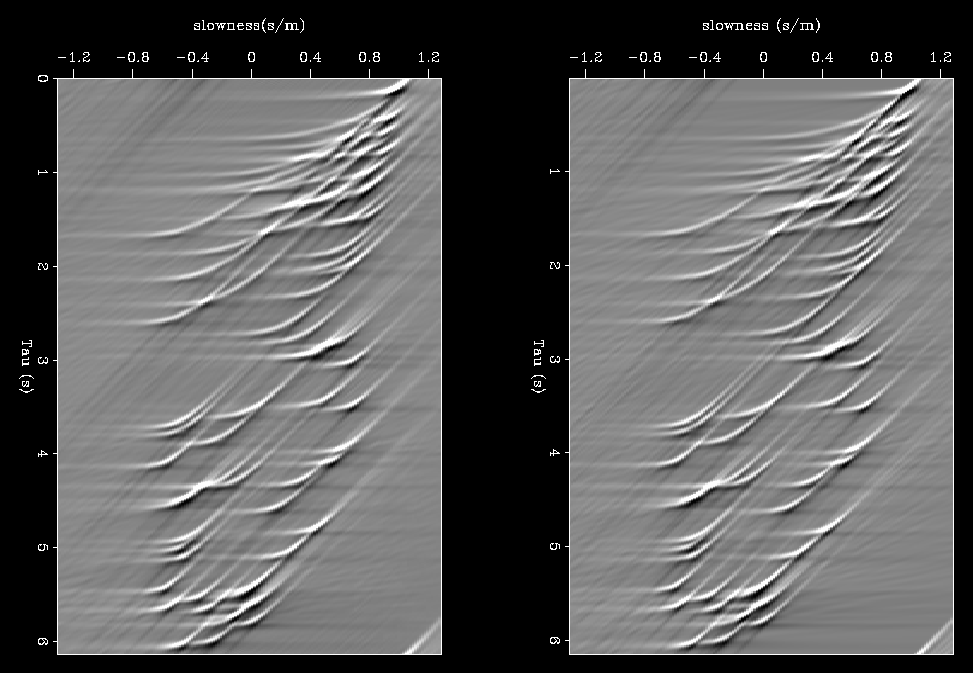
Figure 3 (left) Results of Tiemans method applied to data sampled 80 times along the offset axis; (right) Results of direct application of slant stacks on shot gathers for offset sampled 80 times
The Figures above, Figure 1 and Figure 2, were generated using 80 point sampling along the offset axis. Tiemans method was applied to the cmp gather in Figure 2 while the standard shot gather stack was applied to the shot gather in Figure 2. A comparison of the results reveals that they are almost indistinguishable. Minor differences in overall contrast and clarity can be attributed to the difference in number of Fourier transforms applied. A slight improvement in precision may may favor the Tieman transformed data. The striking similarity of the two images confirms the accuracy of the Tieman transformation.
 |