

Next: Angle-dependent reflectivity recovery
Up: Field data examples
Previous: Near-offset trace interpolation
In order to perform the tomographic velocity estimation,
the first step is to pick reflectors in the image domain
after migration with a velocity model that is first guess.
Figure ![[*]](http://sepwww.stanford.edu/latex2html/cross_ref_motif.gif) shows the initial velocity model
that was used.
The initial velocity model was determined by setting 1500 (m/s)
for the water velocity and linearly increased with respect to depth from
the ocean bottom.
Figure
shows the initial velocity model
that was used.
The initial velocity model was determined by setting 1500 (m/s)
for the water velocity and linearly increased with respect to depth from
the ocean bottom.
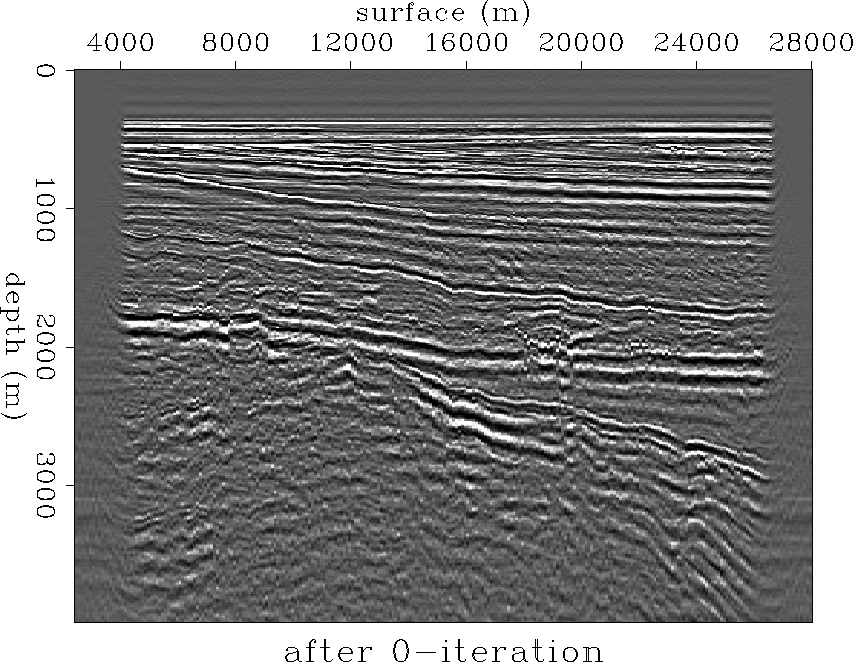
Figure ![[*]](http://sepwww.stanford.edu/latex2html/cross_ref_motif.gif) shows the image obtained
by stacking thirty-one images of the surface-oriented plane-wave synthesis
imaging with -30 through +30 degrees for the incidence angle range.
Figure
shows the image obtained
by stacking thirty-one images of the surface-oriented plane-wave synthesis
imaging with -30 through +30 degrees for the incidence angle range.
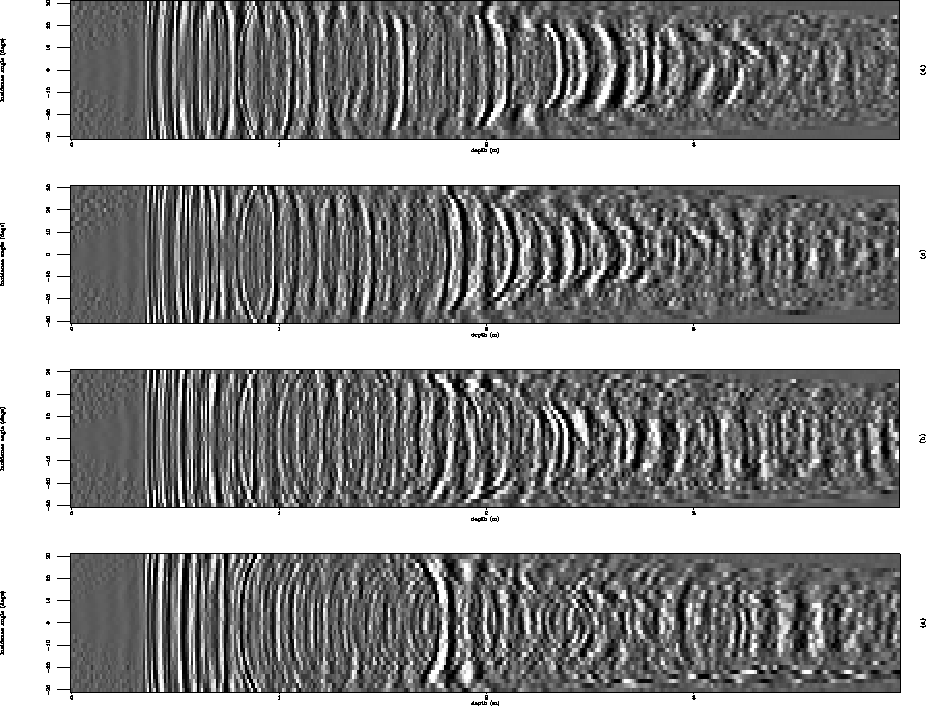
Figure ![[*]](http://sepwww.stanford.edu/latex2html/cross_ref_motif.gif) shows some of the CSL gathers
selected from the image cube before stack and reveals velocity error
by showing curvatures of the reflector images from horizontal aligning
with respect to the incidence angles.
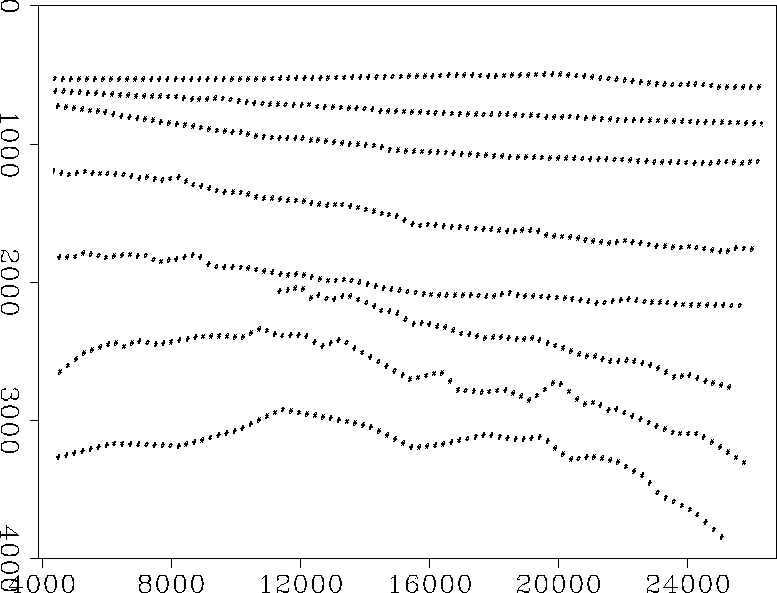
I manually picked eight reflectors to be used for velocity analysis;
these are displayed in Figure
shows some of the CSL gathers
selected from the image cube before stack and reveals velocity error
by showing curvatures of the reflector images from horizontal aligning
with respect to the incidence angles.
I manually picked eight reflectors to be used for velocity analysis;
these are displayed in Figure ![[*]](http://sepwww.stanford.edu/latex2html/cross_ref_motif.gif) .
.
The next step in the tomographic velocity estimation process
is the measurement of traveltime errors along the reflector
picked.
In the algorithm proposed in this thesis (chapter 4),
the traveltime errors are inferred from the residual moveout (RMO)
velocity measured.
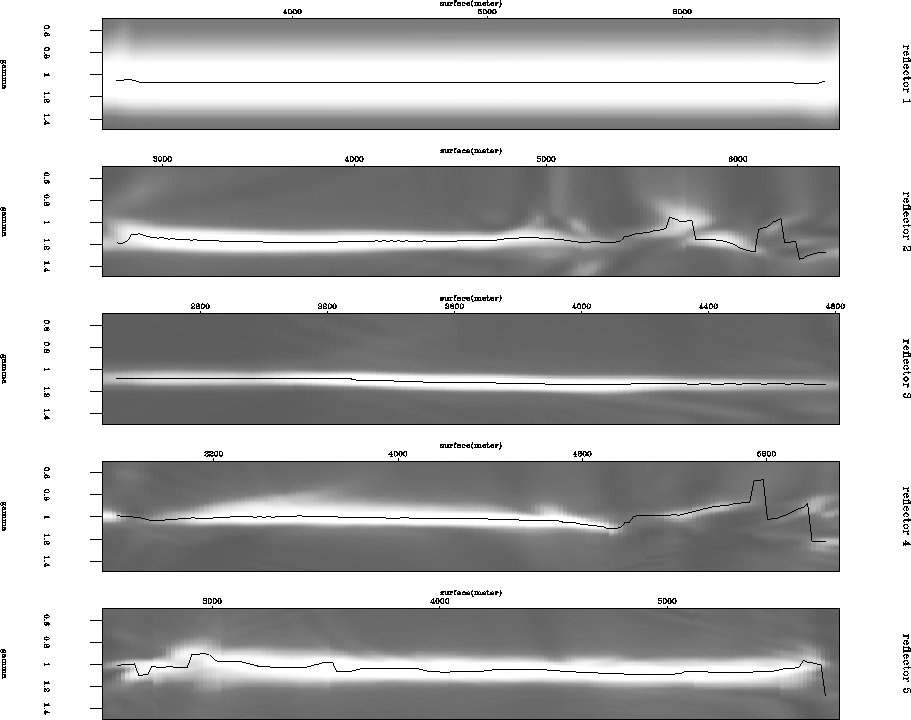
The RMO velocity analysis is performed along the reflector
picked and the results of it are shown in Figure ![[*]](http://sepwww.stanford.edu/latex2html/cross_ref_motif.gif) .
.
Finally the traveltime errors are back projected
to obtain the slowness field error of the reference model.
This requires the calculation of the back projection operator
by means of ray tracing.
A modified reflector location using
the RMO velocity is used to trace rays
instead of using the reflector picked
as the starting location of the ray tracing,
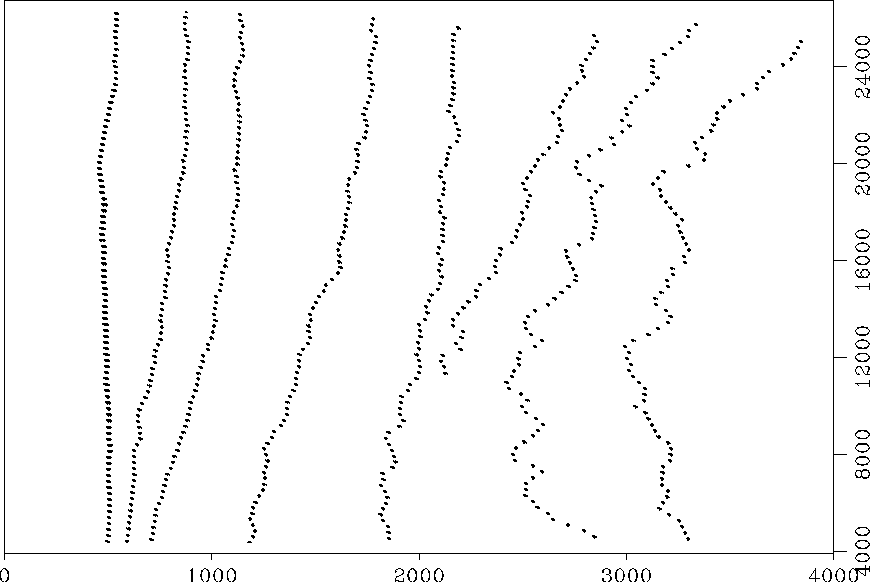
The modified reflector locations are shown in
Figure ![[*]](http://sepwww.stanford.edu/latex2html/cross_ref_motif.gif) .
Figure
.
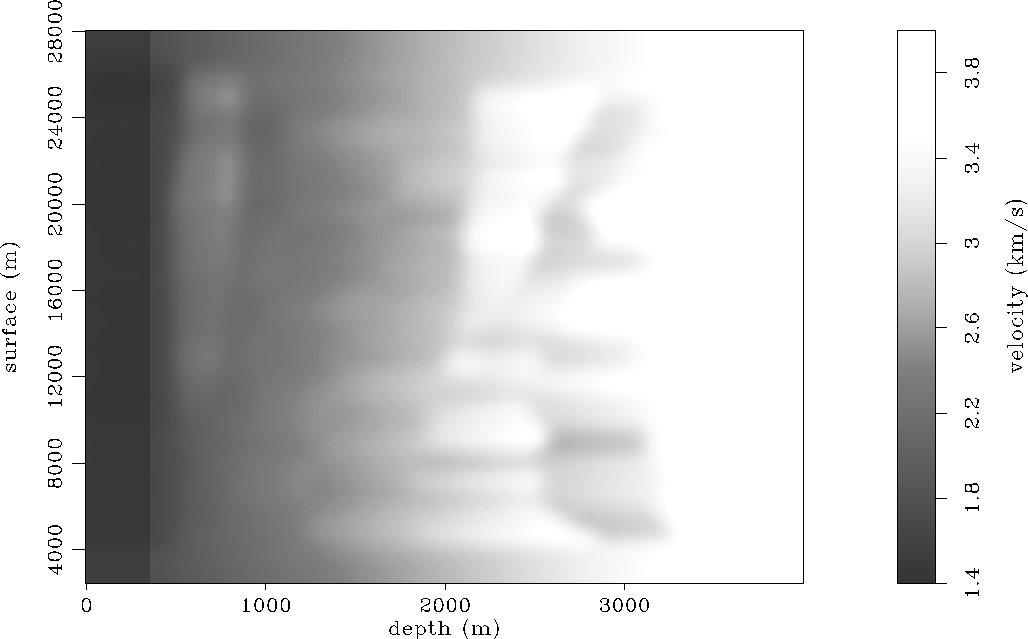
Figure ![[*]](http://sepwww.stanford.edu/latex2html/cross_ref_motif.gif) shows the updated velocity model
that is obtained by inversion of the traveltime errors.
shows the updated velocity model
that is obtained by inversion of the traveltime errors.
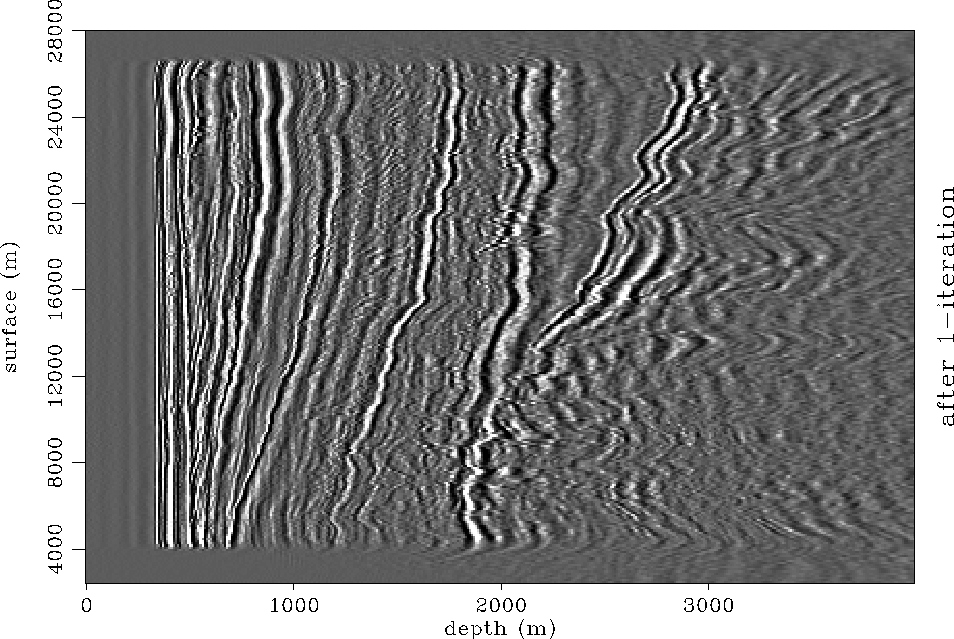
The prestack data set is again imaged with the updated velocity model
by means of plane wave synthesis imaging;
the new image is shown in Figure ![[*]](http://sepwww.stanford.edu/latex2html/cross_ref_motif.gif) .
The CSL gathers shown in Figure
.
The CSL gathers shown in Figure ![[*]](http://sepwww.stanford.edu/latex2html/cross_ref_motif.gif) confirm the accuracy of the velocity updated
by showing horizontal alignment of the images with respect to
the incidence angle.
confirm the accuracy of the velocity updated
by showing horizontal alignment of the images with respect to
the incidence angle.
moint-cmp
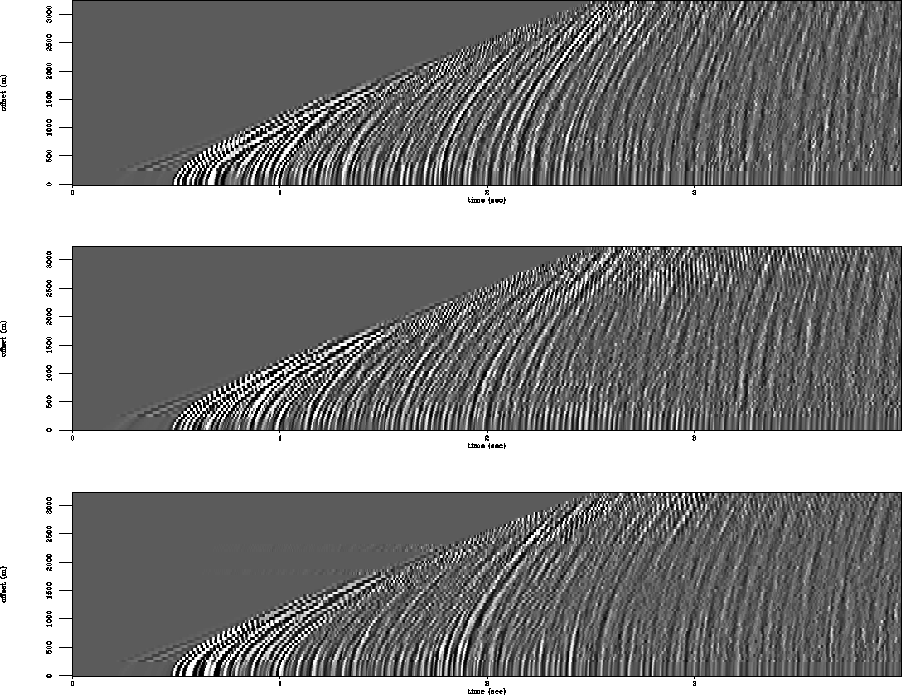
Figure 3 CMP gathers section of Mobil AVO dataset after interpolation.


 mo-vel-iter0
Figure 4 Velocity model of initial guess.


 pws-mo-iter0
Figure 5 Image obtained by thirty-one plane wave syntheses.
 crps-iter0
Figure 6 Selected CSL gathers after zero-iterations.
 pick-mo-iter0
Figure 7 Reflector locations picked for tomographic inversion.
 velan-iter0
Figure 8 Reflector locations positioned according to RMO velocity.
 rfloc-mo-iter0
Figure 9 Reflector locations positioned according to RMO velocity.
 mo-vel-iter1
Figure 10 Velocity model after one iteration of tomographic velocity estimation.
 pws-mo-iter1
Figure 11 Image obtained by thirty-one plane wave syntheses.
 crps-iter1
Figure 12 Selected CSL gathers after one-iteration.


Next: Angle-dependent reflectivity recovery
Up: Field data examples
Previous: Near-offset trace interpolation
Stanford Exploration Project
2/5/2001
![[*]](http://sepwww.stanford.edu/latex2html/cross_ref_motif.gif) shows the initial velocity model
that was used.
The initial velocity model was determined by setting 1500 (m/s)
for the water velocity and linearly increased with respect to depth from
the ocean bottom.
Figure
shows the initial velocity model
that was used.
The initial velocity model was determined by setting 1500 (m/s)
for the water velocity and linearly increased with respect to depth from
the ocean bottom.
Figure ![[*]](http://sepwww.stanford.edu/latex2html/cross_ref_motif.gif) shows the image obtained
by stacking thirty-one images of the surface-oriented plane-wave synthesis
imaging with -30 through +30 degrees for the incidence angle range.
Figure
shows the image obtained
by stacking thirty-one images of the surface-oriented plane-wave synthesis
imaging with -30 through +30 degrees for the incidence angle range.
Figure ![[*]](http://sepwww.stanford.edu/latex2html/cross_ref_motif.gif) shows some of the CSL gathers
selected from the image cube before stack and reveals velocity error
by showing curvatures of the reflector images from horizontal aligning
with respect to the incidence angles.
I manually picked eight reflectors to be used for velocity analysis;
these are displayed in Figure
shows some of the CSL gathers
selected from the image cube before stack and reveals velocity error
by showing curvatures of the reflector images from horizontal aligning
with respect to the incidence angles.
I manually picked eight reflectors to be used for velocity analysis;
these are displayed in Figure ![[*]](http://sepwww.stanford.edu/latex2html/cross_ref_motif.gif) .
.
