 |
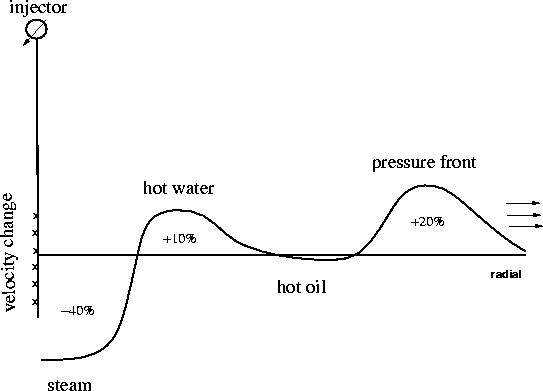
Figure 13 Predicted steamflood P-wave velocity contrast profile compared to initial reservoir conditions as a function of radial distance from the injection well.
Figure 13 shows the predicted velocity contrast profile in the radial direction away from the injector, obtained by combining the rock physics results above. An impedance profile should look similar since density changes are negligible in each zone, except for the steam zone in which the polarity of the contrast is the same as velocity (negative). A rapidly outward-propagating pressure front leads the thermal fronts, and if the reservoir is initially just below the bubble point pressure, the pressure front will appear seismically as an increase in Vp by about 20%, marked by velocity time pull-ups and variable reflection coefficients.
The thermal fronts are likely to lag behind the leading pressure front by many months of steam injection. The outermost thermal front is likely to contain hot oil and be nearly seismically transparent, since it has a negligible velocity contrast. Just behind the hot oil front, a hot water front of condensed steam may exist. It represents a velocity increase of about 10% if the initial 10% gas saturation is reduced to 0%. Finally, a small stable steam zone should surround the injector, perhaps growing in diameter at a very slow rate. This steam zone has a net decrease in Vp of about 40% and should be very visible in the seismic monitor data by strong velocity time delays and very bright reflection coefficients.
 |