 |
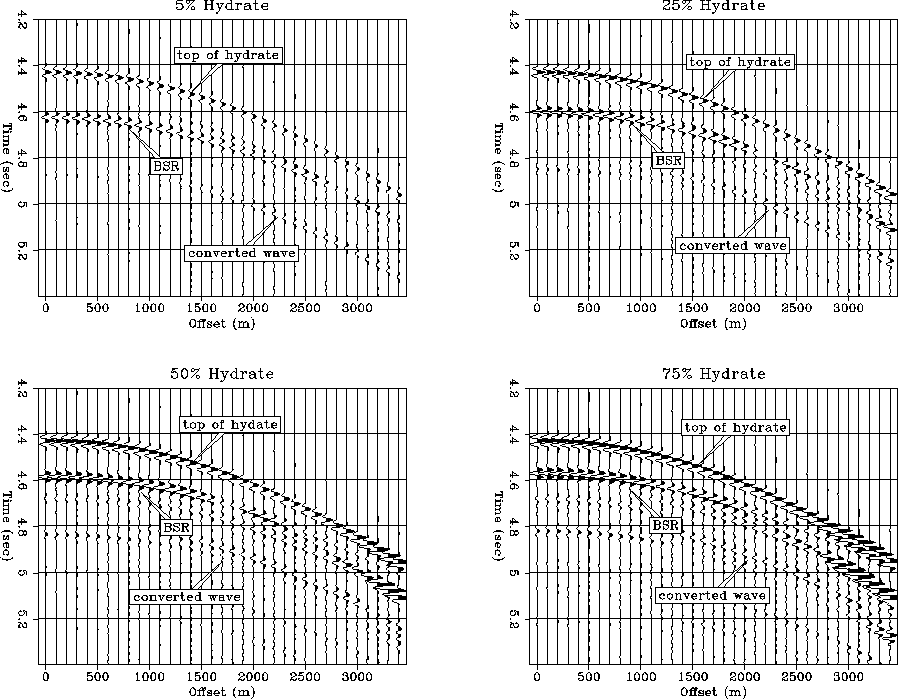
Figure 5 Synthetic seismograms for a cemented hydrate structure containing different amounts of hydrate saturation overlaying brine-saturated sandstone.
First, we modeled the seismic responses of the hydrate-cemented structures. Since the velocity behavior of both cementation possibilities behave in the same way, we chose only the case of uniformly-deposited hydrate on the grain surface for the seismic modeling. Any amplitude responses from the top and bottom of the hydrate layer should be even more pronounced in the case of cementation at the grain contacts, since the velocities in this case are even higher.
Figure 5 shows the synthetic seismograms for different hydrate saturations in the case where the hydrate-bearing sandstone is underlain by brine-saturated sandstone. Both the top and the bottom of the hydrate layer (BSR) produce clear reflections. Since the hydrate layer represents a high velocity zone, the reflection at the BSR, the bottom of the hydrate zone, shows a reversal in polarity. Such a polarity change is frequently associated with BSRs recorded in real seismograms. The near-offset amplitudes from the top and bottom have approximately comparable strength. While the top of the hydrate zone displays a clear increase of amplitude with offset, the BSR response diminishes with increasing offset, and is in fact barely visible there. The higher the hydrate saturation in the layer, the higher the velocity contrast between the hydrate layer and the brine layers, and, consequently, the stronger the reflections from the top and the bottom. Considering that in reality the seismograms are contaminated with noise, the responses of the layer for small amounts of hydrate saturation appears to be too weak to be visible. It is, furthermore, obvious that a large amount of converted waves interfere with the primary signals.
 |
 |
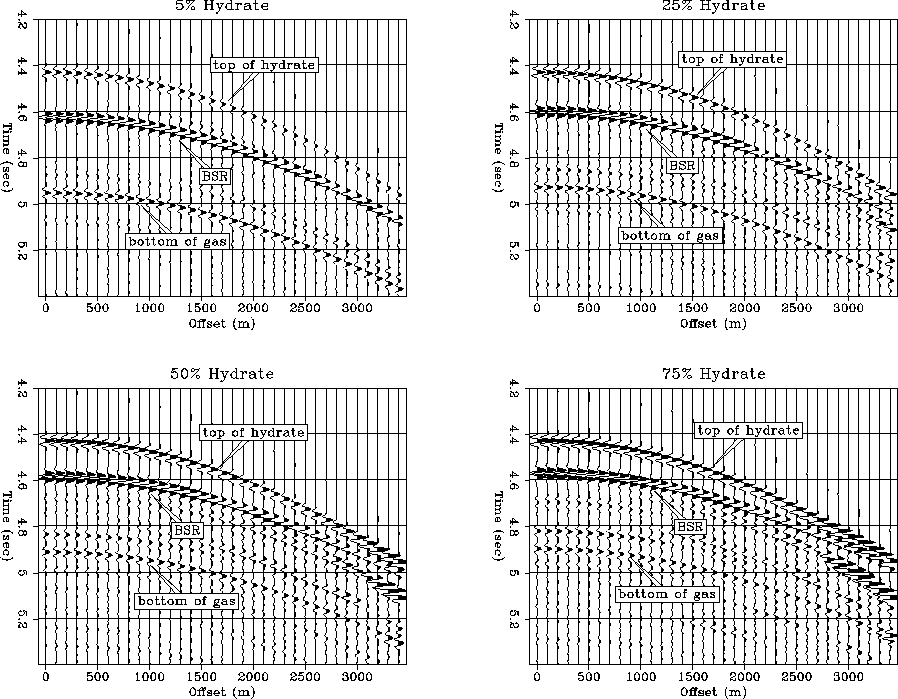
In the case where the hydrate-bearing sandstone is underlain by gas-saturated sandstone, the synthetic modeling results in the seismograms shown in Figure 6. As before, the seismograms display clear reflections from the top and the bottom of the hydrate layer and, additionally, from the bottom of the gas layer. The BSR reflection again has reversed polarity, but appears to have stronger amplitudes than before. This is because there is already a significant velocity contrast for small hydrate saturations. A gas layer has considerably smaller P-wave velocity than a brine layer, thus increasing the P-wave velocity contrast at the BSR. Therefore, the amplitudes at the BSR at the near-offset appear to be stronger than those at the top of the hydrate and the bottom of the gas. As before, the BSR amplitudes decrease with increasing offset.
Both the hydrate-over-brine and the hydrate-over-gas cases show clear reflection signals from the top of the hydrate, that increase with increasing hydrate saturation. In reality, no clear top of the hydrate zone has so far been resolved in seismic sections. This indicates that the hydrate layer has to be a gradual accumulation of hydrate with small amounts of hydrate at the top. Otherwise, the top of the hydrate would result in clear signals visible in seismograms.
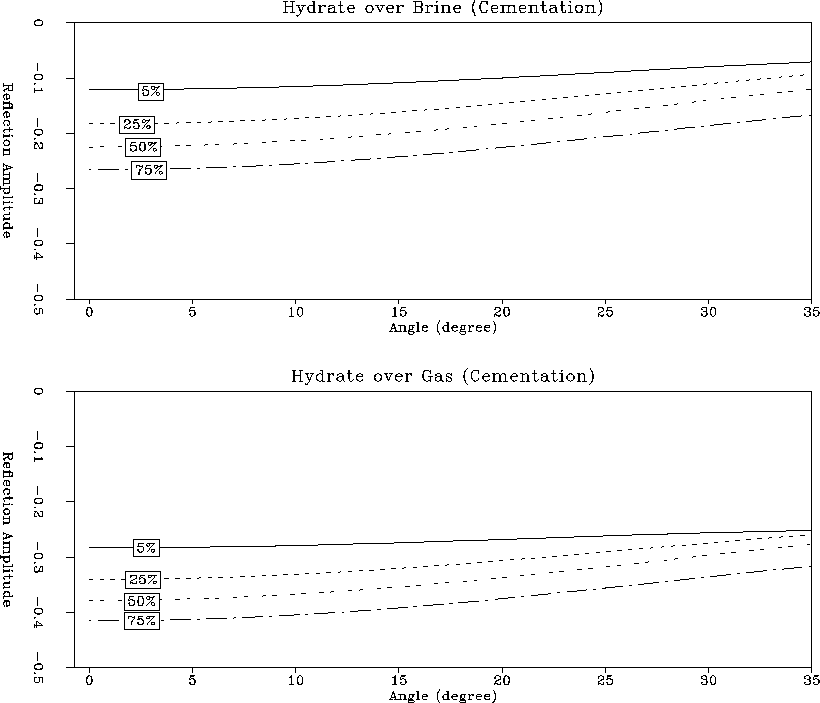
In order to determine the amplitude behavior at the BSR without interfering converted wave or critical angle effects, we calculated the AVO response using Zoeppritz equations. Figure 7 shows the results for hydrate sediment overlaying brine-saturated sandstone and hydrate sediment overlaying gas-saturated sandstone.
 |
It is obvious that in both cases the amplitudes present a clear AVO trend that decreases with increasing offset. The zero-offset reflection amplitude mainly depends on the P-wave velocity contrast between the hydrate and the underlaying sandstone and becomes stronger with increasing velocity contrast. Since the contrast is considerably more pronounced in the case of gas-saturated sandstone, the zero-offset amplitudes in that case are significantly higher. The trend of the amplitudes with increasing offset is solely controlled by the S-wave velocity contrast, since there is no significant change in the density at the transition from hydrate to either brine or gas sandstone. The considerable increase in S-wave velocity compared to that in brine and in gas sandstone causes the amplitudes to decrease with increasing offset.