

Next: Conclusions
Up: Examples
Previous: Synthetic data examples
Real data processed with the prediction prediction show
results similar to the synthetic examples.
It is difficult to confirm which result is better without
independent information.
Wavelet distortion is difficult to recognize in complex real data.
Even so, the reflection amplitudes appear to be improved on
the inversion prediction results when compared to the
prediction-filtering results.
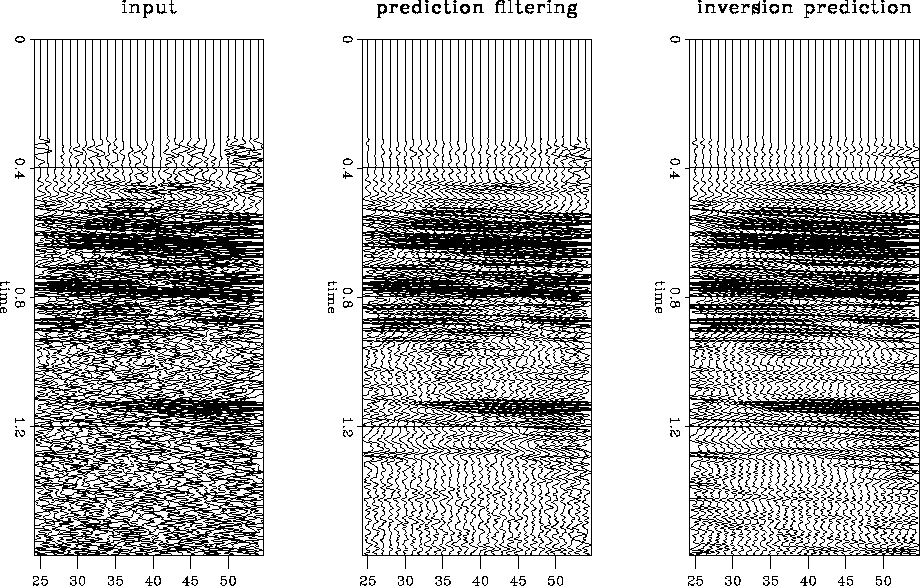
The first section in Figure ![[*]](http://sepwww.stanford.edu/latex2html/cross_ref_motif.gif) shows the input,
a 2-dimensional line from a 3-dimensional survey.
The second section in Figure
shows the input,
a 2-dimensional line from a 3-dimensional survey.
The second section in Figure ![[*]](http://sepwww.stanford.edu/latex2html/cross_ref_motif.gif) shows the result of applying a prediction filter
to the data in the first panel.
The results are significantly better than the input.
The third section in Figure
shows the result of applying a prediction filter
to the data in the first panel.
The results are significantly better than the input.
The third section in Figure ![[*]](http://sepwww.stanford.edu/latex2html/cross_ref_motif.gif) show the results of the inversion prediction.
The amplitudes on the inversion results
are better preserved than the prediction-filter results.
It is difficult to judge whether the events between 1.2 and 1.6 seconds are
organized noise or weak reflections attenuated by the
t-x prediction filter,
but they are likely to be organized noise similar to that seen in the synthetic
examples.
Figure
show the results of the inversion prediction.
The amplitudes on the inversion results
are better preserved than the prediction-filter results.
It is difficult to judge whether the events between 1.2 and 1.6 seconds are
organized noise or weak reflections attenuated by the
t-x prediction filter,
but they are likely to be organized noise similar to that seen in the synthetic
examples.
Figure ![[*]](http://sepwww.stanford.edu/latex2html/cross_ref_motif.gif) shows a close-up of the data in Figure
shows a close-up of the data in Figure ![[*]](http://sepwww.stanford.edu/latex2html/cross_ref_motif.gif) .
The results of the inversion prediction are more appealing than
the t-x prediction-filtering results.
.
The results of the inversion prediction are more appealing than
the t-x prediction-filtering results.
real3
Figure 5
The original data, t-x prediction, and inversion prediction


clsup3
Figure 6
A closeup of the original data, the t-x prediction,
and the inversion prediction.


Next: Conclusions
Up: Examples
Previous: Synthetic data examples
Stanford Exploration Project
2/9/2001
![[*]](http://sepwww.stanford.edu/latex2html/cross_ref_motif.gif) shows the input,
a 2-dimensional line from a 3-dimensional survey.
The second section in Figure
shows the input,
a 2-dimensional line from a 3-dimensional survey.
The second section in Figure ![[*]](http://sepwww.stanford.edu/latex2html/cross_ref_motif.gif) shows the result of applying a prediction filter
to the data in the first panel.
The results are significantly better than the input.
The third section in Figure
shows the result of applying a prediction filter
to the data in the first panel.
The results are significantly better than the input.
The third section in Figure ![[*]](http://sepwww.stanford.edu/latex2html/cross_ref_motif.gif) show the results of the inversion prediction.
The amplitudes on the inversion results
are better preserved than the prediction-filter results.
It is difficult to judge whether the events between 1.2 and 1.6 seconds are
organized noise or weak reflections attenuated by the
t-x prediction filter,
but they are likely to be organized noise similar to that seen in the synthetic
examples.
Figure
show the results of the inversion prediction.
The amplitudes on the inversion results
are better preserved than the prediction-filter results.
It is difficult to judge whether the events between 1.2 and 1.6 seconds are
organized noise or weak reflections attenuated by the
t-x prediction filter,
but they are likely to be organized noise similar to that seen in the synthetic
examples.
Figure ![[*]](http://sepwww.stanford.edu/latex2html/cross_ref_motif.gif) shows a close-up of the data in Figure
shows a close-up of the data in Figure ![[*]](http://sepwww.stanford.edu/latex2html/cross_ref_motif.gif) .
The results of the inversion prediction are more appealing than
the t-x prediction-filtering results.
.
The results of the inversion prediction are more appealing than
the t-x prediction-filtering results.

