![[*]](http://sepwww.stanford.edu/latex2html/cross_ref_motif.gif) through
through ![[*]](http://sepwww.stanford.edu/latex2html/cross_ref_motif.gif) I will illustrate the superiority of wave-equation datuming
for this task.
I will illustrate the superiority of wave-equation datuming
for this task.
The complex structure apparent in this data set calls for prestack depth migration. This requires an accurate interval velocity model. This type of velocity model is usually obtained by integrating well information, geological information, interpreter input, and seismic information into the model building process. Subsequent migration velocity determination is then usually an iterative process involving techniques such as migration velocity analysis and tomography.
An early step in bringing seismic information into the model building loop is to perform conventional velocity analysis and time migration. Wave-equation datuming is applied to data early in the processing flow, so in this section I will demonstrate its effectiveness in improving these early stages of imaging. Wave-equation datuming can not only transform data to a flat processing datum, it can also regularize it onto an evenly sampled computational grid. This is useful for iterative migration velocity estimation because the fastest algorithms are optimized for regularly-sampled data.
Since this data is only 30 fold, conventional CMP velocity analysis is difficult because it is hard to pick the semblance peaks and to maintain geological consistency. As with many low fold land data sets, a better strategy is to generate constant velocity stacks and to pick velocities where laterally continuous and geologically sensible reflection events stack coherently.
When this type of lateral continuity criteria is used to
determine velocity using
geological constraints, it is advantageous to stack with the
data referenced to a flat processing datum. In this way, artificial
structure is not introduced by the use of a floating datum.
This process can be done using elevation statics, or wave-equation
datuming. In Figures ![[*]](http://sepwww.stanford.edu/latex2html/cross_ref_motif.gif) through
through ![[*]](http://sepwww.stanford.edu/latex2html/cross_ref_motif.gif) I will illustrate the superiority of wave-equation datuming
for this task.
I will illustrate the superiority of wave-equation datuming
for this task.
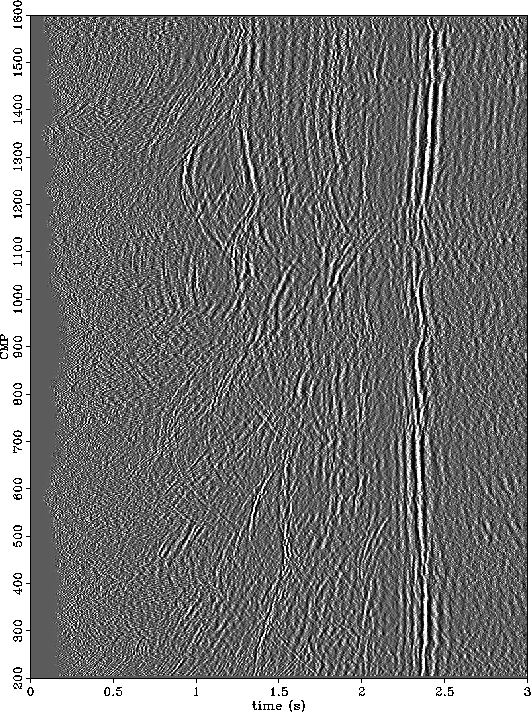
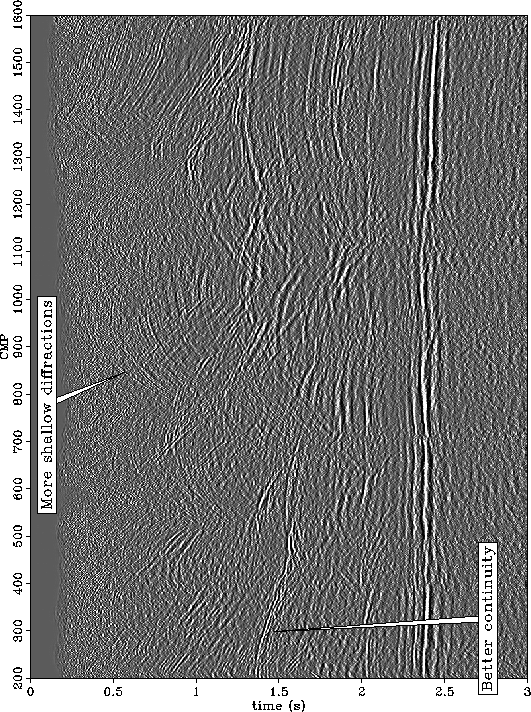
Figures ![[*]](http://sepwww.stanford.edu/latex2html/cross_ref_motif.gif) and
and ![[*]](http://sepwww.stanford.edu/latex2html/cross_ref_motif.gif) are the result of
stacking the data after elevation statics and after wave-equation
datuming using an approximate stacking velocity.
The reflection event at about 2.5 s is the most prominent
feature in the data. The stack displays better lateral
continuity after wave-equation datuming (Figure
are the result of
stacking the data after elevation statics and after wave-equation
datuming using an approximate stacking velocity.
The reflection event at about 2.5 s is the most prominent
feature in the data. The stack displays better lateral
continuity after wave-equation datuming (Figure ![[*]](http://sepwww.stanford.edu/latex2html/cross_ref_motif.gif) ) than
after elevation statics (Figure
) than
after elevation statics (Figure ![[*]](http://sepwww.stanford.edu/latex2html/cross_ref_motif.gif) ).
This is particularly evident between CMP 1000 and 1200 along the
2.5 s reflector. The dipping reflectors above 1 s and to the right of
CMP 1300 are much better defined after wave-equation datuming than
after static shift. Two other prominent features that look better
after wave-equation datuming are the flat reflection event running
across the section at about 2 s, and the dipping event at about 1.5 s,
running from CMP 200 to 500.
The diffraction events in the middle of the stacked sections are a
little harder to evaluate, but it is evident that there are more
diffractions at early time in the wave-equation datumed stack.
).
This is particularly evident between CMP 1000 and 1200 along the
2.5 s reflector. The dipping reflectors above 1 s and to the right of
CMP 1300 are much better defined after wave-equation datuming than
after static shift. Two other prominent features that look better
after wave-equation datuming are the flat reflection event running
across the section at about 2 s, and the dipping event at about 1.5 s,
running from CMP 200 to 500.
The diffraction events in the middle of the stacked sections are a
little harder to evaluate, but it is evident that there are more
diffractions at early time in the wave-equation datumed stack.
 |
 |
![[*]](http://sepwww.stanford.edu/latex2html/movie.gif)
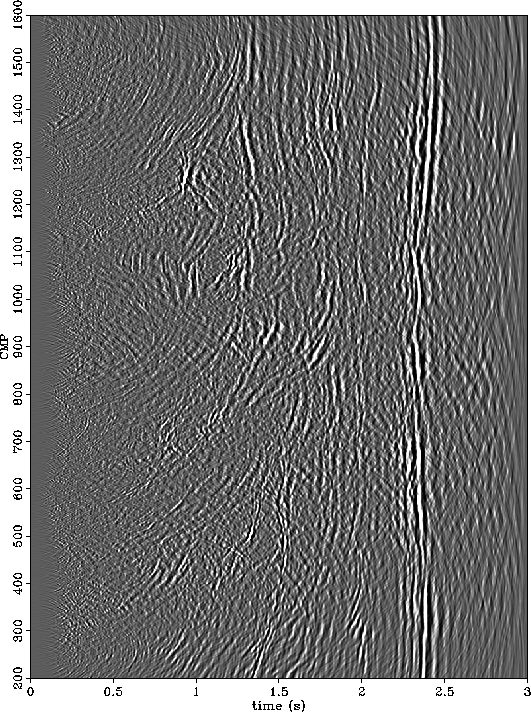
After migration, the superiority of wave-equation datuming before
stack over static shift becomes even more evident.
The result of migration after static shift is displayed in Figure ![[*]](http://sepwww.stanford.edu/latex2html/cross_ref_motif.gif) and the result of migration after wave-equation datuming is displayed in
Figure
and the result of migration after wave-equation datuming is displayed in
Figure ![[*]](http://sepwww.stanford.edu/latex2html/cross_ref_motif.gif) .
.
As before, better event continuity is preserved in Figure ![[*]](http://sepwww.stanford.edu/latex2html/cross_ref_motif.gif) after wave-equation datuming. The 2 s and 2.5 s reflectors running
along the length of the section are more continuous, and the dipping
events in the upper right corner of the image are better imaged.
The dipping event extending from CMP 200 to 500 is more continuous
after datuming. In Figure
after wave-equation datuming. The 2 s and 2.5 s reflectors running
along the length of the section are more continuous, and the dipping
events in the upper right corner of the image are better imaged.
The dipping event extending from CMP 200 to 500 is more continuous
after datuming. In Figure ![[*]](http://sepwww.stanford.edu/latex2html/cross_ref_motif.gif) , this
event can be followed to CMP 1000 at 1.8 s where it pinches out.
This interpretation could not be confidently made using
the image in Figure
, this
event can be followed to CMP 1000 at 1.8 s where it pinches out.
This interpretation could not be confidently made using
the image in Figure ![[*]](http://sepwww.stanford.edu/latex2html/cross_ref_motif.gif) .
.
The migration after static shift does
not image the complex structures in the middle of the section as well
as the migration after wave-equation datuming. The diffraction events
in Figure ![[*]](http://sepwww.stanford.edu/latex2html/cross_ref_motif.gif) have collapsed nicely to image the near-surface
structure. One of the most prominent structural features that is imaged
in Figure
have collapsed nicely to image the near-surface
structure. One of the most prominent structural features that is imaged
in Figure ![[*]](http://sepwww.stanford.edu/latex2html/cross_ref_motif.gif) is the dipping spoon-like event extending
from coordinates (750,1.2) to (950, 1.4). The whole structure in
this region and above is fairly complex and is much better imaged
in Figure
is the dipping spoon-like event extending
from coordinates (750,1.2) to (950, 1.4). The whole structure in
this region and above is fairly complex and is much better imaged
in Figure ![[*]](http://sepwww.stanford.edu/latex2html/cross_ref_motif.gif) than in Figure
than in Figure ![[*]](http://sepwww.stanford.edu/latex2html/cross_ref_motif.gif)
Figure ![[*]](http://sepwww.stanford.edu/latex2html/cross_ref_motif.gif) is a good starting image that is much easier
to interpret than Figure
is a good starting image that is much easier
to interpret than Figure ![[*]](http://sepwww.stanford.edu/latex2html/cross_ref_motif.gif) . Geological boundaries
could be readily defined and used to build a preliminary interval
velocity model which could then be further refined by prestack
depth migration.
. Geological boundaries
could be readily defined and used to build a preliminary interval
velocity model which could then be further refined by prestack
depth migration.
Better imaging of this data could be achieved by prestack migration
or even by DMO before stack. However, the point here is to compare the
effects of static shift and wave-equation datuming. The important
point is that other than the datum correction step, both
images in Figure ![[*]](http://sepwww.stanford.edu/latex2html/cross_ref_motif.gif) and
and ![[*]](http://sepwww.stanford.edu/latex2html/cross_ref_motif.gif) went through the
same processing flow.
went through the
same processing flow.
 |
 |
![[*]](http://sepwww.stanford.edu/latex2html/movie.gif)