

Next: Recursive Kirchhoff continuation
Up: Synthetic examples
Previous: Downward continuation
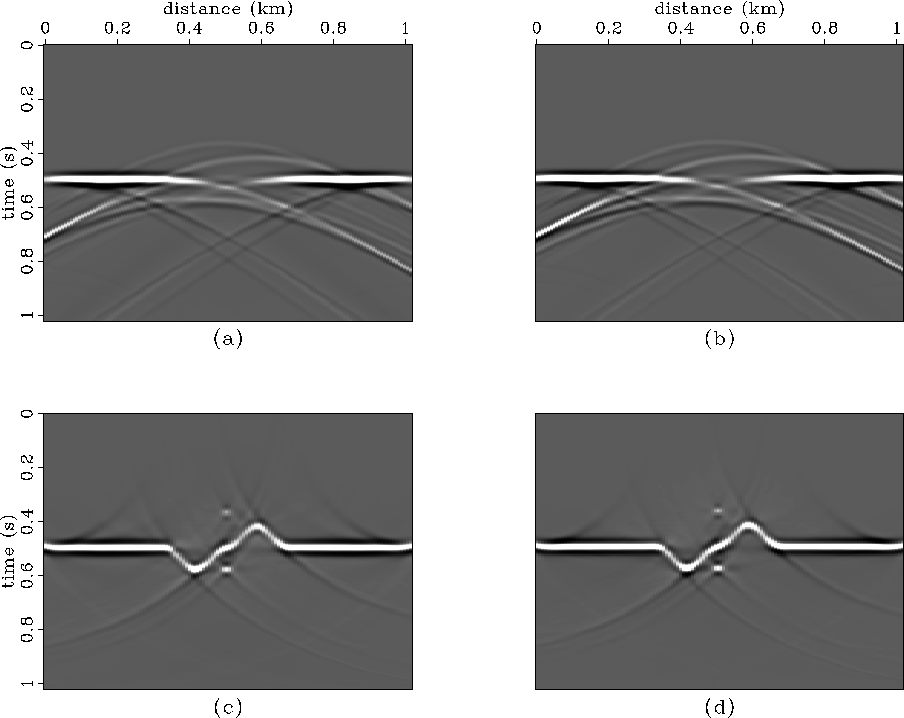
Figure ![[*]](http://sepwww.stanford.edu/latex2html/cross_ref_motif.gif) is a comparison of
two Kirchhoff upward continuations. In Figure
is a comparison of
two Kirchhoff upward continuations. In Figure ![[*]](http://sepwww.stanford.edu/latex2html/cross_ref_motif.gif) a
the near-field term is retained, and in Figure
a
the near-field term is retained, and in Figure ![[*]](http://sepwww.stanford.edu/latex2html/cross_ref_motif.gif) b
the far-field approximation is made so that equation (
b
the far-field approximation is made so that equation (![[*]](http://sepwww.stanford.edu/latex2html/cross_ref_motif.gif) )
is applied directly.
Both results are kinematicly equivalent, but there is a small difference
in amplitude and phase behavior, especially
for small time shifts
)
is applied directly.
Both results are kinematicly equivalent, but there is a small difference
in amplitude and phase behavior, especially
for small time shifts  near the center of the plots where the
topography is close to the output datum.
The result of migrating Figures
 ![[*]](http://sepwww.stanford.edu/latex2html/cross_ref_motif.gif) a and
a and ![[*]](http://sepwww.stanford.edu/latex2html/cross_ref_motif.gif) b
is presented in Figure
b
is presented in Figure ![[*]](http://sepwww.stanford.edu/latex2html/cross_ref_motif.gif) c and
c and ![[*]](http://sepwww.stanford.edu/latex2html/cross_ref_motif.gif) d.
There is not much discernible difference between these two plots.
d.
There is not much discernible difference between these two plots.
Figure ![[*]](http://sepwww.stanford.edu/latex2html/cross_ref_motif.gif) shows that
as the data are upward continued to a datum that is 100 m
above the topography, the amplitude and phase behavior of the near-field
and far-field Kirchhoff extrapolations converge.
This is further illustrated in Figures
shows that
as the data are upward continued to a datum that is 100 m
above the topography, the amplitude and phase behavior of the near-field
and far-field Kirchhoff extrapolations converge.
This is further illustrated in Figures ![[*]](http://sepwww.stanford.edu/latex2html/cross_ref_motif.gif) and
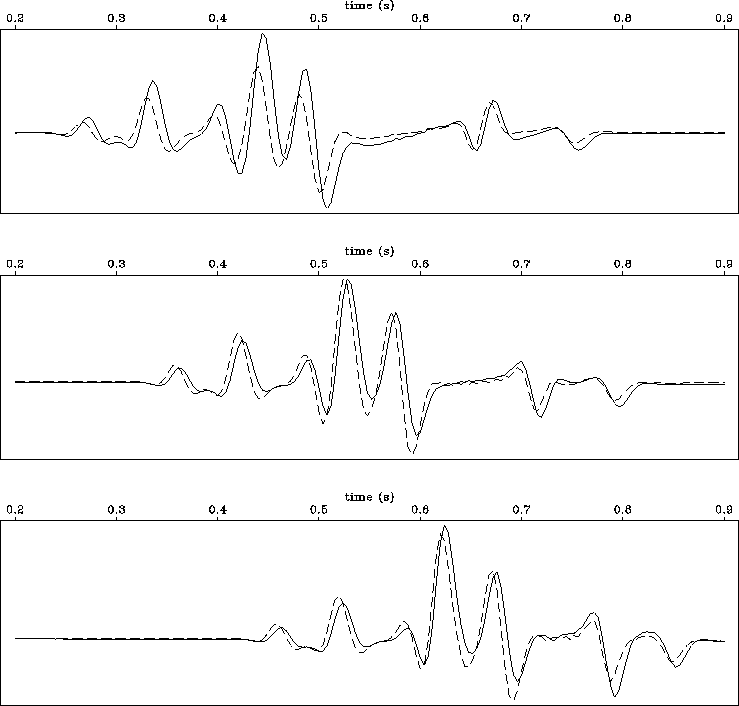
and ![[*]](http://sepwww.stanford.edu/latex2html/cross_ref_motif.gif) where traces from two lateral locations
are compared after upward continuation with the near-field
and far-field Kirchhoff datuming operators.
The top traces in Figure
where traces from two lateral locations
are compared after upward continuation with the near-field
and far-field Kirchhoff datuming operators.
The top traces in Figure ![[*]](http://sepwww.stanford.edu/latex2html/cross_ref_motif.gif) , where the time shift
, where the time shift  is small, exhibit a substantial difference in amplitude and phase.
With increasing extrapolation distance, the differences are not as
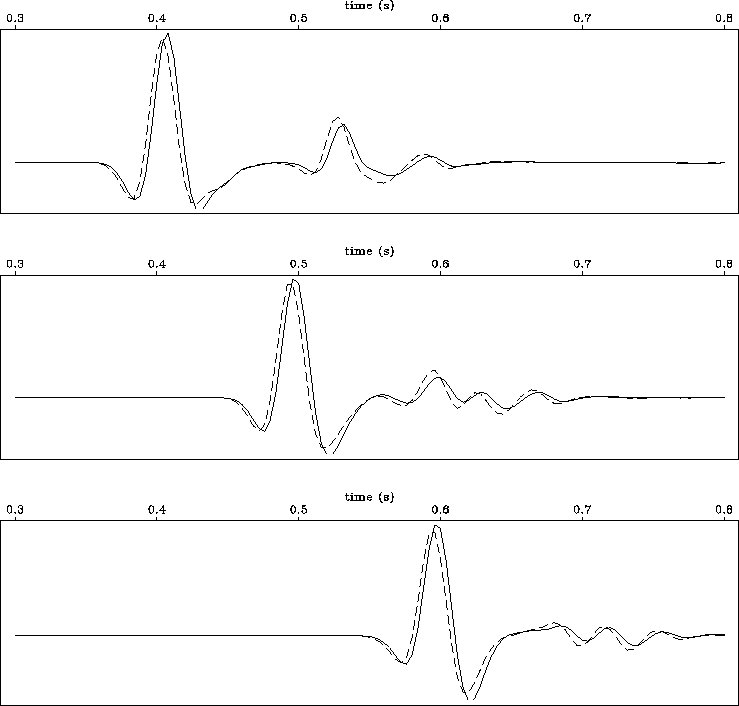
pronounced. In Figure
 ![[*]](http://sepwww.stanford.edu/latex2html/cross_ref_motif.gif) I compare two traces at a location
where the synthetic wavefield is simpler and where the extrapolation
distance is longer because the recording surface is far from
the output datum.
I compare two traces at a location
where the synthetic wavefield is simpler and where the extrapolation
distance is longer because the recording surface is far from
the output datum.
From these examples, I conclude that for most cases, the far-field approximation
to the Kirchhoff integral is adequate. This is especially true if the
data are subject to wave-based processing (in this case, time migration)
after datuming. This is significant because it is
computationally more efficient to implement Kirchhoff datuming
if the near-field term is dropped.
nearvsfar.21
Figure 12 Comparison of (a) near-field Kirchhoff datuming and
(b) far-field Kirchhoff datuming.
Comparison of migrated (c) near-field Kirchhoff datuming and
(d) far-field Kirchhoff datuming. The data have been upward continued to
a datum just above the highest topography.


 nearvsfar.3
Figure 13 Comparison of (a) near-field Kirchhoff datuming and
(b) far-field Kirchhoff datuming.
The migrations of the top two panels are presented in c and d.
The data have been upward continued to
a datum 100 m above the highest topography.


 diffnfmid
Figure 14 Comparison of traces at horizontal position of 0.5 km for near-field
and far-field Kirchhoff datuming. Near-field result is plotted as a
continuous line, far-field result is plotted as a dashed line.
The plots are for output datum levels of 210 m (top), 300 m (middle),
and 400 m (bottom).


 diffnfside
Figure 15 Comparison of traces at horizontal position of 0.25 km for near-field
and far-field Kirchhoff datuming. Near-field result is plotted as a
continuous line, far-field result is plotted as a dashed line.
The plots are for output datum levels of 210 m (top), 300 m (middle),
and 400 m (bottom).


Next: Recursive Kirchhoff continuation
Up: Synthetic examples
Previous: Downward continuation
Stanford Exploration Project
2/12/2001
![[*]](http://sepwww.stanford.edu/latex2html/cross_ref_motif.gif) is a comparison of
two Kirchhoff upward continuations. In Figure
is a comparison of
two Kirchhoff upward continuations. In Figure ![[*]](http://sepwww.stanford.edu/latex2html/cross_ref_motif.gif) a
the near-field term is retained, and in Figure
a
the near-field term is retained, and in Figure ![[*]](http://sepwww.stanford.edu/latex2html/cross_ref_motif.gif) b
the far-field approximation is made so that equation (
b
the far-field approximation is made so that equation (![[*]](http://sepwww.stanford.edu/latex2html/cross_ref_motif.gif) )
is applied directly.
Both results are kinematicly equivalent, but there is a small difference
in amplitude and phase behavior, especially
for small time shifts
)
is applied directly.
Both results are kinematicly equivalent, but there is a small difference
in amplitude and phase behavior, especially
for small time shifts ![[*]](http://sepwww.stanford.edu/latex2html/cross_ref_motif.gif) a and
a and ![[*]](http://sepwww.stanford.edu/latex2html/cross_ref_motif.gif) b
is presented in Figure
b
is presented in Figure ![[*]](http://sepwww.stanford.edu/latex2html/cross_ref_motif.gif) c and
c and ![[*]](http://sepwww.stanford.edu/latex2html/cross_ref_motif.gif) d.
There is not much discernible difference between these two plots.
d.
There is not much discernible difference between these two plots.


