

![[*]](http://sepwww.stanford.edu/latex2html/prev_gr.gif)


ABSTRACTNoise attenuation by prediction filtering breaks down in the presence of high-amplitude noise when the prediction filter is corrupted by noise and the filter response to the noise overwhelms the signal. Spurious events are generated and the amplitude of the signal is reduced by prediction filtering under these circumstances. To reduce these undesired effects, the separation of signal and noise is posed as an inversion problem. The inversion process preserves signal amplitudes and attenuates spurious events. |
Prediction filtering techniques, such as t-x and f-x prediction filtering methods, break down in the presence of high-amplitude noise. This breakdown is partially caused by the corruption of the prediction filter by noise. The response of the filter to the noise can also contribute to the breakdown when it overwhelms weak reflections.
Both of these problems can be overcome by posing the noise removal as an inversion problem. This inversion removes the filter response from the calculated noise; plus, the inversion allows the filter to be recalculated without the noise corruption. The recalculated filter allows improved signal prediction.
In this paper, I will show how the noise removal may be posed as an inversion problem and how the noise estimate from prediction filtering is used to increase the accuracy and speed of the solver. The combination of the inversion and the recalculation of the filter will be shown to preserve the amplitude of reflectors and to reduce spurious events generated by the prediction filtering(). The process is demonstrated on synthetic and real data.
SHORTCOMINGS OF PREDICTION FILTERING
High amplitude noise produces flaws in prediction filtering techniques such as t-x and f-x prediction filtering. One flaw is the reduction of reflection amplitudes. Another is the generation of spurious events(). Both these errors are due to the corruption of the signal prediction filter by the noise in the data from which the filter is calculated.
Another, less obvious, flaw in prediction filtering
is that, even with a filter that
perfectly predicts the signal,
the output of this filtering does not perfectly
separate the signal and noise.
To demonstrate this,
take d as the available data,
s as the signal, and n as the noise.
The relationship between the data, the signal, and the noise is
assumed to be d=s+n.
Although the prediction of the signal could be stated otherwise,
the prediction is done here with a signal annihilation filter S.
The filter S is a purely lateral 2- or 3-dimensional filter
as discussed in Abma .
If this filter is perfect, it completely removes the signal
so that Ss=0.
In fact, only an approximate signal annihilation filter is
available so that ![]() ,but to simplify the following discussion,
Ss=0 is assumed.
When the data d is filtered by the exact signal annihilation filter,
the result is Sd = Ss + Sn, which becomes Sd = Sn, since
Ss=0.
Since prediction filtering defines the noise as approximately Sd,
a filtered version of the noise Sn is obtained from the prediction filtering
instead of the actual noise n.
,but to simplify the following discussion,
Ss=0 is assumed.
When the data d is filtered by the exact signal annihilation filter,
the result is Sd = Ss + Sn, which becomes Sd = Sn, since
Ss=0.
Since prediction filtering defines the noise as approximately Sd,
a filtered version of the noise Sn is obtained from the prediction filtering
instead of the actual noise n.
Prediction filtering makes the assumption that the noise n is unaffected by the signal annihilation filter S. The difference between Sn and n may also be seen as an inconsistency between definitions of the noise in the expressions n=d-s and n=Sd (). For weak noise and large filters, the assumption that the noise n is unaffected by the signal annihilation filter S is reasonable. For strong noise and short filters, the response of the noise to the filter is important. Although prediction filters may be made as large as desired, I have shown in Abma and Abma that large filters allow more noise to pass into the signal and that filters that are large along the time axis tend to create spurious events. This is a special problem with f-x prediction, since the effective filter time length is as long as the window length in time. For very high amplitude noises, the filter response is alway significant.
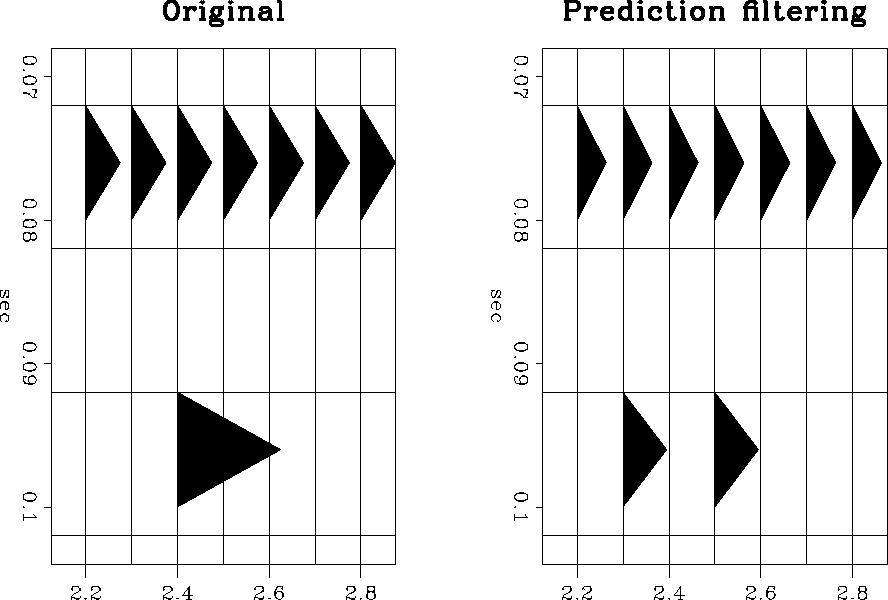
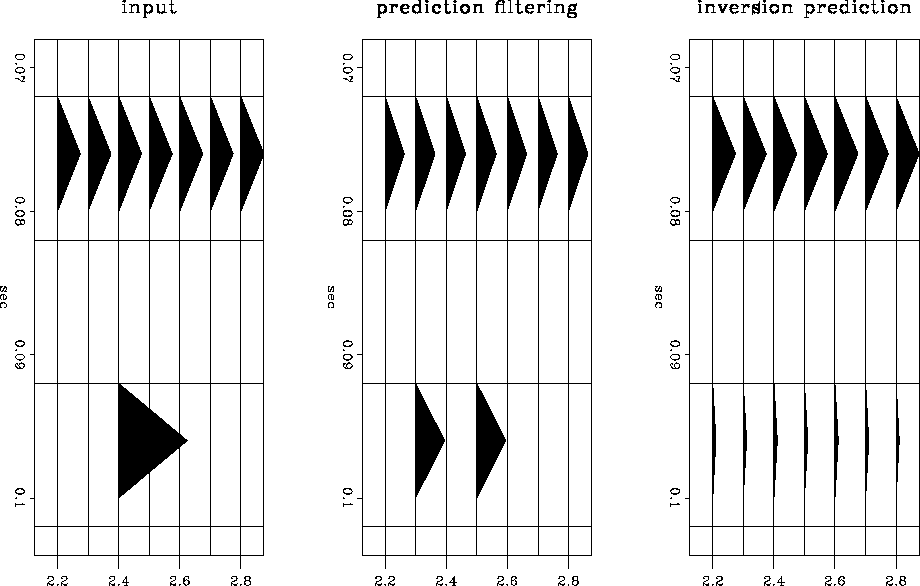
An example of the filter response to noise is shown in Figure respn. In the original data seen in this figure, the signal is a flat event and the noise is the isolated spike. Since the prediction filter is applied in two directions, the response of the signal annihilation filter S can be seen on both sides of the spike's position in the prediction filter result. The prediction filtering result also shows a small amplitude loss in the flat event. The corruption of the signal annihilation filter S by the spike caused this amplitude loss.
 |

Getting a more accurate calculation of the noise requires
solving the expression Sd=Sn when Ss=0.
If the exact signal annihilation filter is not available
and ![]() ,
the noise must be solved for from the regression
,
the noise must be solved for from the regression ![]() .Similar expressions have been used for noise removal
by Claerbout and Abma
and Abma and Claerbout.
In the next section I will present a solution to
.Similar expressions have been used for noise removal
by Claerbout and Abma
and Abma and Claerbout.
In the next section I will present a solution to ![]() .
.
NOISE ESTIMATION BY INVERSION
For a given signal annihilation filter S,
the expression ![]() is used to get
the noise n from the data.
The expression
is used to get
the noise n from the data.
The expression ![]() is not useful in itself for calculating the noise n,
since the filter S is not perfect and
is unlikely to completely annihilate the
signal to the point where the inversion for n could not restore it.
Without additional constraints,
the obvious solution to
is not useful in itself for calculating the noise n,
since the filter S is not perfect and
is unlikely to completely annihilate the
signal to the point where the inversion for n could not restore it.
Without additional constraints,
the obvious solution to ![]() is d=n.
In earlier work, I found that,
although the filter S could attenuate the signal significantly,
a simple inversion of
Sd = Sn for n restores much of the signal
into the calculated noise n.
is d=n.
In earlier work, I found that,
although the filter S could attenuate the signal significantly,
a simple inversion of
Sd = Sn for n restores much of the signal
into the calculated noise n.
The constraint used here to keep signal out of the calculated noise
is that the noise is approximately
the noise estimated from prediction filtering Sd.
This is a reasonable approximation, since
Sd should be about equal to the actual noise.
The difference between the actual noise n
and the noise approximated by Sd
should be fairly small and involves only the response of
the noise to the filter S.
This approximation is weighted as ![]() .The value for
.The value for ![]() may be changed to account for the signal-to-noise
ratio of the data.
may be changed to account for the signal-to-noise
ratio of the data.
The system of regressions to be solved is now
| (1) |
Since this system estimates n from the approximation Sd, it is reasonable to initialize n to Sd before entering the iterative solver. Another reason for initializing n to Sd is that the filter S is generally small and will pass only a limited range of spatial and temporal frequencies. In the case of a spike in the data, inversion for the noise with a small filter does not allow the complete restoration of the spike. Because the noise is expected to be almost white and in some cases dominated by spikes, initializing n to Sd improves the calculation of n and reduces the number of iterations needed.
Equation eqnappr3 expressed as a minimization of the residual r is
| (2) |
| (3) |
| (4) |
| (5) |
The results of inversion prediction are sensitive to the value of ![]() .At present, the optimum value of
.At present, the optimum value of ![]() is uncertain.
It would seem that
is uncertain.
It would seem that ![]() should decrease as the signal-to-noise
ratio decreases, since the difference between the actual noise n
and the estimated noise Sd is larger.
However, in the presence of strong noise,
the larger
should decrease as the signal-to-noise
ratio decreases, since the difference between the actual noise n
and the estimated noise Sd is larger.
However, in the presence of strong noise,
the larger ![]() is, the more stable the inversion should be.
If
is, the more stable the inversion should be.
If ![]() is relatively large, around 1.0,
the amplitudes of the reflections are preserved and spurious events
are somewhat suppressed.
As
is relatively large, around 1.0,
the amplitudes of the reflections are preserved and spurious events
are somewhat suppressed.
As ![]() gets very large, the result approaches the prediction
filter result.
When
gets very large, the result approaches the prediction
filter result.
When ![]() gets small, the amplitudes of the reflectors are
attenuated, since the signal filter S does not perfectly annihilate
the signal before the inversion.
For small
gets small, the amplitudes of the reflectors are
attenuated, since the signal filter S does not perfectly annihilate
the signal before the inversion.
For small ![]() , the spurious events tend to return also.
The best value of
, the spurious events tend to return also.
The best value of ![]() appears to be different for samples with Gaussian noise than
for samples with uniformly distributed noise.
For most work, it appears that good values of
appears to be different for samples with Gaussian noise than
for samples with uniformly distributed noise.
For most work, it appears that good values of ![]() vary
from 0.1 to 3.0.
Small values of
vary
from 0.1 to 3.0.
Small values of ![]() remove background noise, but seem
to introduce organized noise into the calculated signal.
For the real data examined,
the background noise increases as
remove background noise, but seem
to introduce organized noise into the calculated signal.
For the real data examined,
the background noise increases as ![]() increases,
and the continuity of the data increases as
increases,
and the continuity of the data increases as ![]() decreases.
Further work is needed to determine how the strength and type
of noise affects the value of
decreases.
Further work is needed to determine how the strength and type
of noise affects the value of ![]() .
.
An example of the difference between prediction filtering and inversion prediction is seen in Figure onespikea. The filter S is calculated from the data to predict the flat event. When S is applied to the spike, the filter response can be seen in the prediction filter result. The inversion prediction result has effectively eliminated the filter response.
 |
IMPROVING THE SIGNAL PREDICTION FILTER
In the previous discussion, it was assumed that the
signal filter S completely annihilates the signal, that is Ss=0.
In reality, imperfect filters are derived from noisy data.
For prediction filtering,
the filters are derived from
the least-squares solutions to the expression Sd = 0.
Since the data d contains noise,
rather than getting an S where Ss = 0, we must contend
with an imperfect S such that ![]() .This section shows how a better S may be calculated by reducing
the influence of the noise.
.This section shows how a better S may be calculated by reducing
the influence of the noise.
The presence of noise in the estimation of the signal annihilation filter S affects the calculation of the estimated signal in two ways. First, spurious events may be generated. These events may be widely separated in f-x prediction or may be seen as distortions of an event's wavelet. The cause of these distortions is discussed in Abma. Second, the amplitudes of the reflectors in the calculated signal are reduced due to the imperfect prediction. As the strength of the noise increases, the more corrupted the filter becomes and the more the reflectors are attenuated.
To improve the calculation of the filter S, S should be derived from the signal s instead of the data d. Since the actual signal is unavailable, the inversion prediction result from equation eqnappr3 is used to get an estimate of the signal. Although the signal estimate is not perfect because S is imperfect, this signal estimate can be used to create a new S that is less affected by the noise. The process of calculating the signal, then getting a new signal annihilation filter, may be iterated as often as desired.
At this point, you might wonder why we should bother with the inversion when a cleaned-up signal might be obtained from prediction filtering result. The inversion is necessary because the signal annihilation filter calculated from the signal derived from prediction filtering will be exactly the same as the original filter calculated from the data. The residual r in the filter calculation expression r=Sd becomes zero when the data d is replaced by the signal estimated from prediction filtering. This is because all the noise calculated in prediction filtering is orthogonal to S, so everything in the remaining signal fits S perfectly. Therefore, the inversion result is needed to produce an updated filter which the prediction filtering result cannot produce.
Once an improved signal filter S is calculated from the estimated signal, this new filter may be used either to produce an improved prediction filtering result, or it may be used to derive another inversion prediction result. If the response of the filter to the noise is assumed to be small, the improved prediction filtering result might be the final result, but generally, if the noise is large enough to corrupt the filter, the response of the filter to the noise should be removed with inversion prediction.
Figures synth3 and graph3 in the next section show that iterating the calculation of the signal annihilation filter has the desired effect of preserving the amplitudes of the calculated signal and reducing the wavelet distortion in cases of small signal-to-noise ratios. Both effects are the result of removing some of the noise from the data used in the filter calculations. The amplitude improvement is a straightforward result of having a filter that predicts the signal well, rather than having a filter that predicts the signal poorly. The reduction of the generated spurious events results from the filter not being forced by the noise to use events parallel to the predicted events to improve the predictions().
In the examples shown in the next section, three iterations of estimating the signal annihilation filter S were used. I've found that one or two iterations do not allow the amplitudes of the reflections to be restored properly and more iterations seem to weaken the reflections. More work needs to be done to find how the number of iterations affects weak events that do not line up with the strongest events in a section. It is possible that iterating tends to eliminate weak events not lined up with the strongest reflections, since a preliminary filter might attenuate a weak event which then would not be recovered in the following passes.
EXAMPLES
Synthetic data examples
The first synthetic example is one previously used in Abma to show how t-x prediction filtering can generate spurious events that appear as wavelet distortions. Figure synth3 shows how inversion prediction for the noise using equation eqnappr3rr compares to prediction filtering. Although the inversion prediction result shows more organized noise in the background than the prediction filtering result, the amplitude of the signal is better preserved in the inversion prediction result. Close-ups of the wavelets are seen in Figure graph3. Notice that the input event has been distorted by the t-x prediction filter result. While the inversion prediction result still shows some distortion of the wavelet, the distortion is small and the amplitude of the wavelet is better preserved than it is in the prediction filtering result.
 |
|
graph3
Figure 4 A single trace taken from the right side of the data. The original reflection on the top shows a three-point wavelet. The middle plot is the t-x prediction result. The bottom plot is the inversion prediction result. | 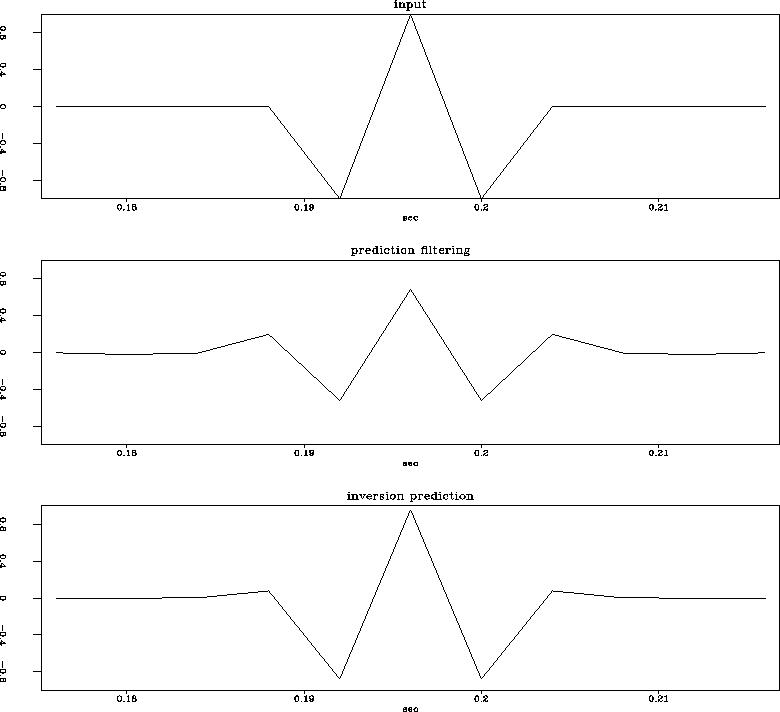 |
Real data examples
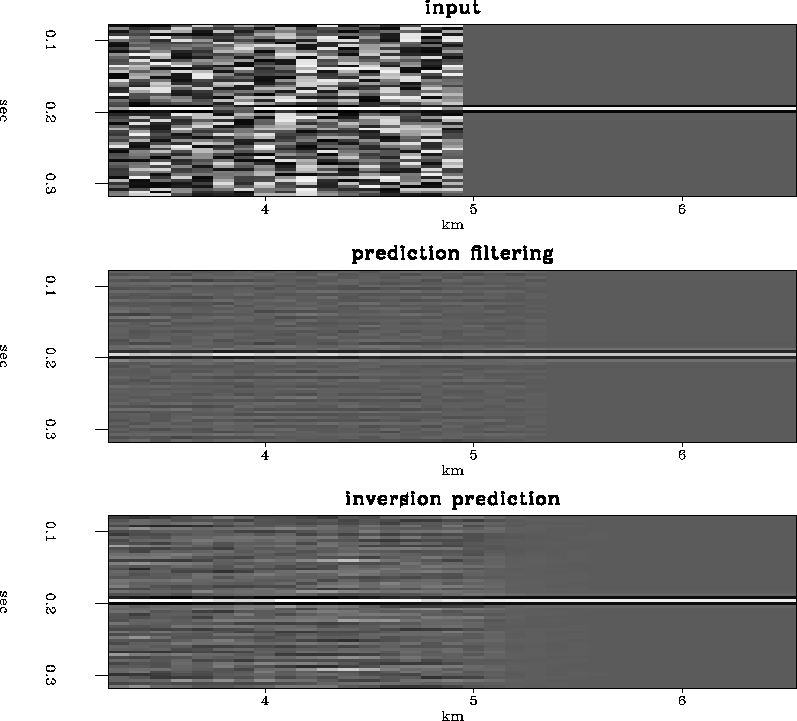
Real data processed with the inversion prediction show results similar to the synthetic examples, although, wavelet distortion is difficult to recognize in complex real data. Even so, the reflection amplitudes appear to be improved on the inversion prediction results when compared to the prediction filtering results.
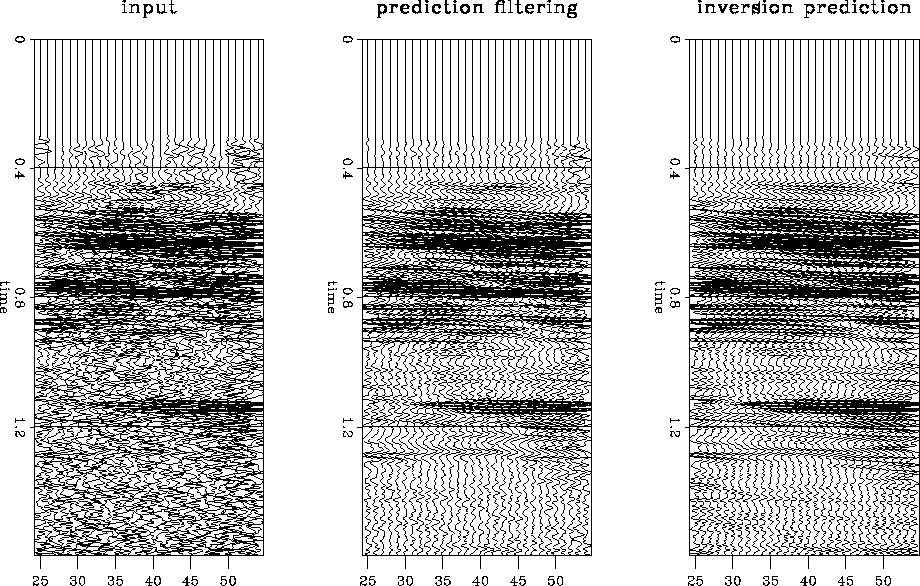
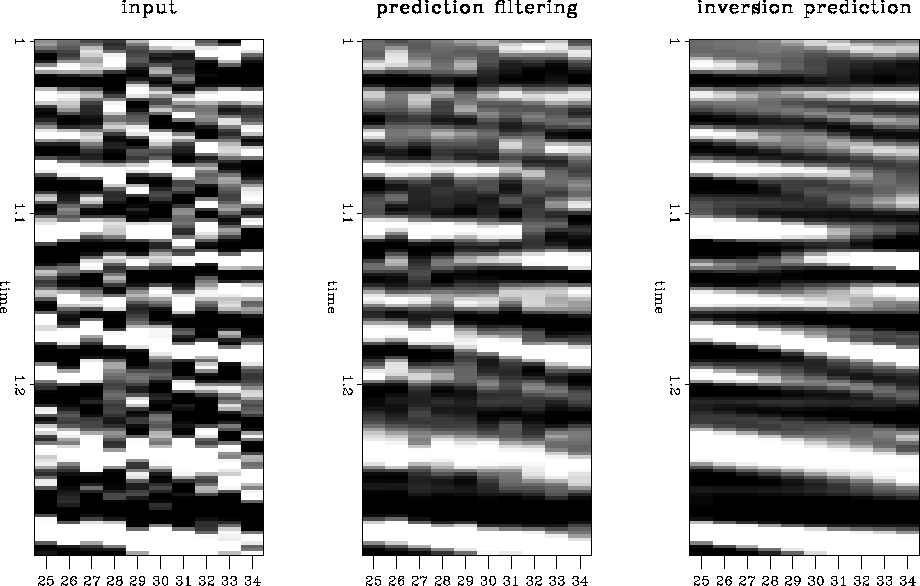
The first section in Figure real3 shows the input, a 2-D line from a 3-D survey. The second section in Figure real3 shows the result of applying a prediction filter to the data in the first panel. The results are significantly better than the input. The third section in Figure real3 show the results of the inversion prediction. Although it is difficult to see in the displays here, the amplitudes on the inversion results can be seen to be better preserved than the prediction filter results. It is difficult to judge whether the events between 1.2 and 1.6 seconds are organized noise or weak reflections attenuated by the t-x prediction filter, but they are likely to be organized noise similar to that seen in the synthetic examples. Figure clsup3 show a close-up of the data in Figure real3. The results of the inversion prediction are more appealing than the t-x prediction filtering results.
 |
 |
CONCLUSIONS
In the presence of strong noise, prediction filtering attenuates reflections and produces spurious events. Inversion prediction preserves the reflection amplitudes and reduces the amplitudes of the spurious events. While I was hoping for an improvement in the signal-to-noise ratio over prediction filtering, the signal-to-noise ratio of inversion prediction generally appears to be about equal to that of prediction filtering. Inversion prediction removes the response of the filter to the noise, however this effect is difficult to see in real seismic data. The main advantage of the inversion prediction technique may be to clean up the signal annihilation filter in the presence of strong noise. For real seismic data, preserving the signal amplitude and reducing the amplitudes of spurious events may be more important than eliminating the filter response. However, if the noise consists of very large spikes, eliminating the filter response becomes important. Removing the filter response with the inversion may have more effect on the calculation of an improved filter than it does on the interpretation of the section.
In the future, I intend to use the ideas presented here, especially those of initializing the noise estimate to the prediction filtering result, to improve the accuracy and decrease the expense of prestack signal and noise separation.
I would like to thank ARCO for providing the real seismic data.
[mybib]