 |
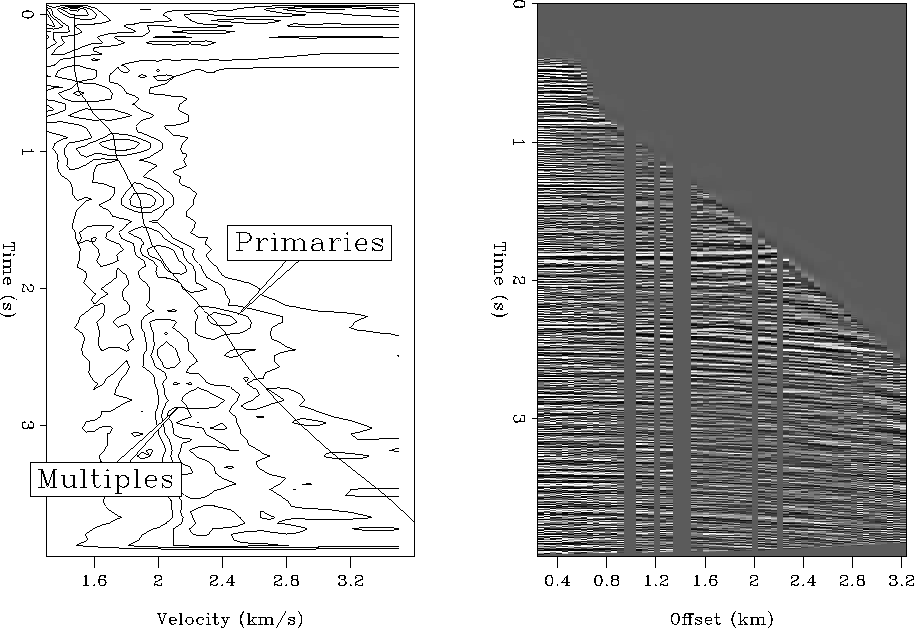
Figure 1 The left frame shows a velocity semblance scan. The Monte Carlo rms-velocity pick is represented by the solid line passing through the contours. The right panel shows the CMP gather NMO-corrected with this velocity function.
![[*]](http://sepwww.stanford.edu/latex2html/prev_gr.gif)
Christine Ecker and David E. Lumley
christin@sep.stanford.edu, david@sep.stanford.edu
In our last SEP report, we introduced an AVO dataset consisting of seismic, petrophysical and well-log information which was provided by Mobil as part of an AVO workshop (). The prestack seismic data are heavily contaminated by free-surface and water-bottom multiple reflections, and thus represent a challenge for true-amplitude processing. We described our preliminary preprocessing work and discussed model-building and synthetic seismograms that we planned to use to test our true-amplitude processing methods. Furthermore, we gave a brief overview of our plans for AVO analysis and impedance inversion.
In this paper, we present the current results of the AVO dataset analysis, including a high-resolution velocity analysis, stacking and migration of the data. Using a version of the seismic data on which Mobil had applied their parabolic Radon multiple suppression, we produced densely-spaced velocity semblance scans in the midpoint direction. A Monte Carlo nonlinear fitting technique () was then used to generate optimal rms-velocity functions and an associated geologically reasonable interval velocity model at each CMP position. After careful preprocessing, including spherical divergence correction, directivity calibration, amplitude balancing and moveout traveltime calibration, we stacked the data and subsequently produced a migrated stacked section.
VELOCITY ANALYSIS
A version of the AVO dataset provided by Mobil after their parabolic Radon multiple suppression served as an input to our high-resolution velocity analysis. As a first step, we generated velocity scans at every eighth CMP gather along the seismic line. These velocity scans were further processed by a running midpoint average and nonlinear scaling to enhance reflection velocity peaks. An automatic Monte Carlo nonlinear fitting technique () was then applied to obtain an optimal rms-velocity function and an associated interval velocity function at each CMP gather.
A final velocity semblance scan with its rms-velocity function is shown in the left panel of Figure nmo-ann. The velocity scan clearly shows the primaries and residual multiples that were not removed with the parabolic Radon transform. The traveltime and velocities of the multiples indicate that they are water-column multiples, which represent primaries reverberating between the free surface and the water bottom. Although the multiples still contain a large amount of energy, the rms-velocity clearly follows the primary trend, suggesting a good agreement with the actual velocities in the area. The quality of the velocity trend is examined by NMO correcting one CMP gather, which is shown on the right side of Figure nmo-ann. While the shallow reflectors are corrected properly, some deeper reflections appear to contain residual NMO effects. A comparison of these events with the velocity scan shows that, in fact, the major energy at the deeper zones is distributed in multiple and not in primary energy. Thus, the apparently over-corrected events in the NMO corrected gather represent multiple reflections that are crossing through the primaries.
Since the Monte Carlo velocity fitting technique determines a rms-velocity model that is based on a physical interval velocity model, we also obtained a geologically reasonable interval velocity model of the data. This model is compared with the sonic velocities measured in the well-logs A and B (Figure vel). The low-frequency trend curves represent the velocities obtained by the velocity analysis while the high-frequency trends represent the sonic velocities measured in the well-logs. Since the well-log information starts from a depth of approximately 1000 meters, it does not include the shallow parts of the marine sediments. We thus assumed a P-wave velocity of approximately 1.8 km/s and an S-wave velocity of approximately 0.6 km/s. Missing well-log velocity values were approximated using linear interpolation. The comparison of the well-log velocity trend with the low-frequency velocity trend that we determined shows that they match very well. Since the well-log data were not used for the velocity analysis, the good agreement of the two velocity trends supports the accuracy of the velocity analysis.
 |
 |
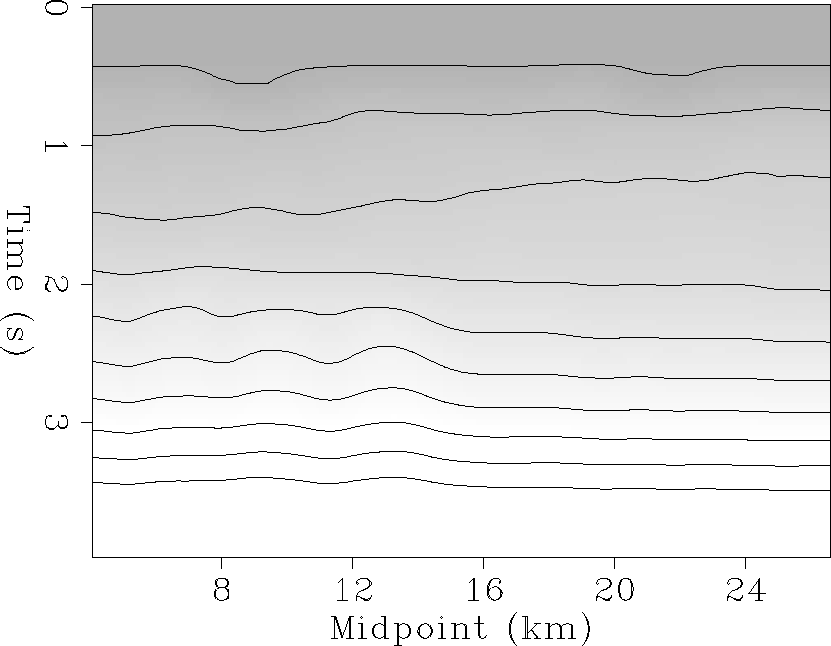
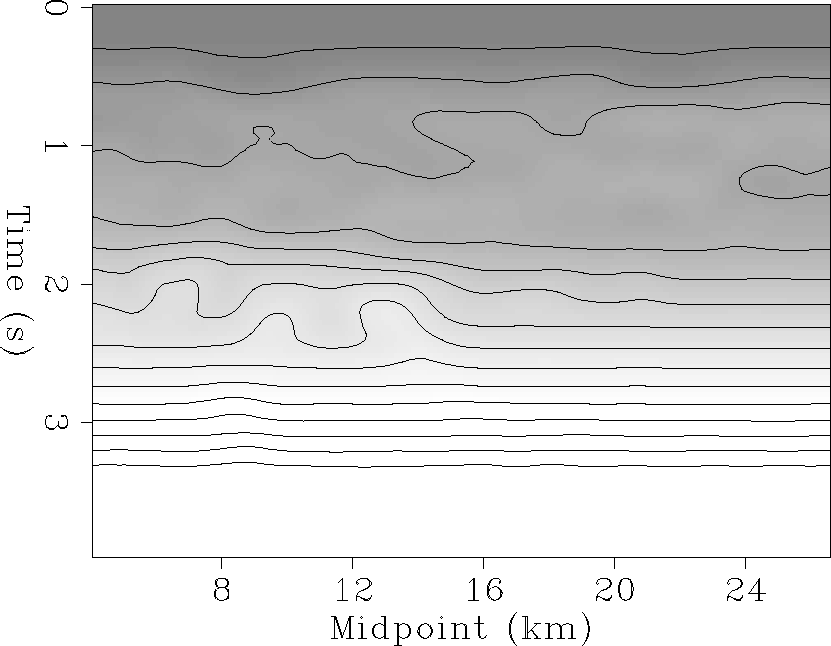
After having performed the velocity analysis on every eighth CMP gather, we interpolated the velocity functions between the gathers and obtained both an rms-velocity model and an interval-velocity model for the entire seismic line. Subsequent median filtering and smoothing of the models resulted in the rms model shown in Figure rms and the interval model shown in Figure int. In both models, lateral velocity variations can be observed. Shallow velocities appear to increase along the line. Between 2.0 and 2.5 seconds two-way traveltime, a ``blocky'' velocity structure is visible along the first half of the seismic line. This blocky characteristic vanishes at increasing midpoints, but might be indicative of fault-block velocity structure in the first half of the line.
 |
 |
MIGRATED STACK SECTION
In order to examine the image of the area resulting from the estimated
velocity model, we generated a post-stack migrated section of the
seismic data. Prior to stacking, we carefully processed the Mobil
multiple-suppressed data.
First, we applied a time-varying spherical divergence
correction. Next, a source and receiver amplitude balancing was performed
on the data ().
The balanced data were then corrected
for source and receiver directivity assuming a directivity of
![]() for both source and receiver.
After these amplitude calibrations,
we performed a moveout traveltime correction with the
estimated velocities,
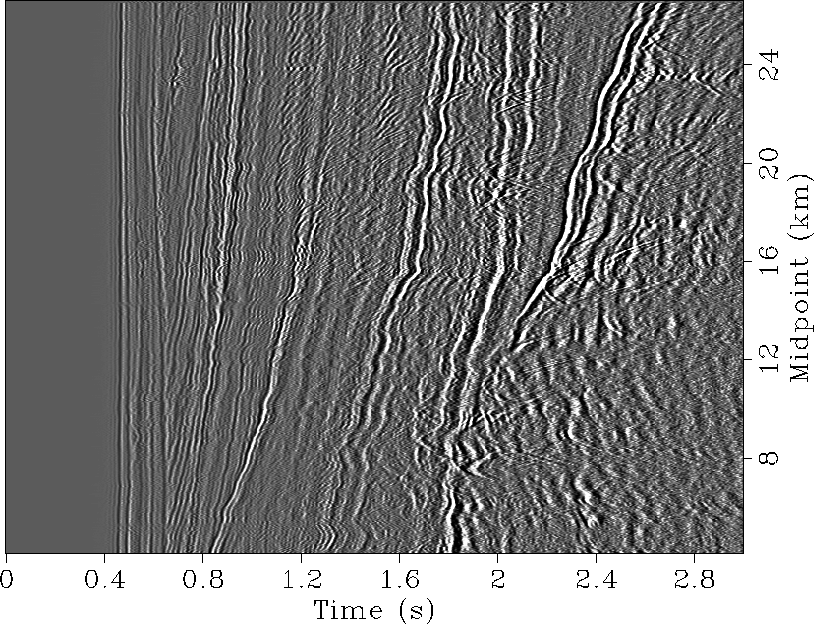
and generated a stacked section of the seismic line (Figure stack).
Although the stacked section displayes the major structure in the area quite
well, it is dominated by a significant number of diffractions.
Using an
amplitude-preserved Kirchoff migration (),
we produced the post-stack time-migrated section
shown in Figure stack2.
for both source and receiver.
After these amplitude calibrations,
we performed a moveout traveltime correction with the
estimated velocities,
and generated a stacked section of the seismic line (Figure stack).
Although the stacked section displayes the major structure in the area quite
well, it is dominated by a significant number of diffractions.
Using an
amplitude-preserved Kirchoff migration (),
we produced the post-stack time-migrated section
shown in Figure stack2.
 |
 |
The migrated section shows interesting structure in the area. The shallow sediments are dipping gently along the line and display a considerable amount of fine-scale faulting. The deeper sediments dip in the same direction as the shallow reflectors. A significant unconformity occurs below 2 seconds two-way traveltime, representing one of the target zones in the area. The second target zone is at approximately 1.5 seconds two-way traveltime. Below the unconformity, the structure is dominated by partially-imaged faults and apparent horst-graben rotated blocks. This deep structure seems recent since it is partially expressed in shallower structure above the major unconformity.
Comparison of the stacked sections with the velocity models determined in the preceding section (Figure rms, Figure int) shows that the dip direction of the shallow sediments is opposite to the velocity trend indicated by the rms- and interval-velocity model. This may be caused by deposition of fine-grained sediments down-dip, in contrast to coarser sediments up-dip. Compaction of the fine-grained sediments would result in a higher velocity than compaction of the coarser sediments, thus creating a velocity trend counter to the bedding trend. Furthermore, it can be seen that the blocky structure exhibited in the velocity model between 2 and 2.5 seconds corresponds to the faults and rotated horst-graben blocks below the major unconformity in the migrated section.
SUMMARY
We have presented the results of a high-resolution stacking velocity analysis on the Mobil AVO data. Although the data contain high-energy residual multiple reflection energy, we succeeded in obtaining both a good rms-velocity model and a reasonable interval velocity model that compared favorably to two sonic logs from wells along the line. The post-stack migrated section gives a good initial stuctural image of the area, indicating shallow fine-scale faulting, a major unconformity at 2 seconds, and deep horst-graben fault-block rotation.
The next step in our analysis will be to perform a conventional unmigrated AVO analysis, and a prestack migration/inversion P and S impedance estimation. Before this AVO analysis can be undertaken, Lumley et al. plan to apply their true-amplitude multiple suppression scheme to the raw Mobil data. The results of these studies will be presented at the SEG AVO workshop in Los Angeles this October.
We thank Bob Keys and Stew Levin at Mobil Oil for providing us with the Mobil AVO dataset.
[MISC,SEP]
![[*]](http://sepwww.stanford.edu/latex2html/prev_gr.gif)