

![[*]](http://sepwww.stanford.edu/latex2html/prev_gr.gif)


Next: About this document ...
Up: Table of Contents
Ray methods in rough models
Thorbjørn Rekdal and Biondo Biondi
Author has no known email address
ABSTRACT
First arrival traveltime methods have proven to fail to image
deeper structure, when most of the reflected energy is transported by
later arrivals.
The family of ray tracing methods is one of the few available alternatives
to generate Green's functions with multiple arrivals. Dynamic ray methods
also compute amplitudes and phase-shifts.
Even in rough structures, ray methods can be used to
compute useful Green's functions, if the model is properly smoothed.
We discuss ways to obtain a good image with Green's functions
computed with the paraxial ray tracing method in the 2-D Marmousi model.
Our paraxial ray tracing implementation uses the paraxial and
regularity conditions to limit the region where the paraxial solution for
a specific ray is useful.
Smoothing the model, does not only make the model more ``ray valid'',
but also makes the high frequency wavefield more like the band-limited
solution. We apply a merging of phases technique
to reduce two nearby arrivals into one. This technique reduces the high
frequency noise
in the image significantly at a similar cost as using just the most
energetic arrival. Smoothing over a length proportional
to the local wavelength of the center-frequency, results in a better
image than just smoothing over a constant length. Using the two most
energetic arrivals, instead of just the most energetic, improves the image
of the ``target'' zone.
|
INTRODUCTION
During the past few years, there has been a significant increase in
applying 3-D data recordings and 3-D imaging. 3-D imaging is
computationally intensive, and much effort
has been expended to find cheap and efficient ways to do the full 3-D
prestack Kirchhoff depth migration.
First arrival traveltime methods are not always sufficient, and
the family of asymptotic ray methods is, especially in 3-D, one
of the few alternatives.
Dynamic ray tracing methods are not as fast as
many first arrival traveltime methods. However, recent developments
demonstrate that there are ways to make the ray computations
more efficiently, e.g. Vinje et al . A more
serious problem is that for rough models, the ray validity conditions are no
longer fulfilled, e.g. Ben-Menahem and Beydoun .
The ray methods are high frequency approximations, which are only valid
if the model varies smoothly over a wavelength.
To make rough models more ``ray-valid'', they have to be smoothed.
Versteeg experimented with smoothing
in the Marmousi model, and found that the velocity could
be smoothed with a Gaussian bell shaped operator with radius up to 200 m,
while still obtaining a reasonable image with shot profile finite-difference
modeling. Another way to compute Green's function in a rough
model, is to use band-limited methods. A recent method ()
computes band-limited Green's functions by solving the Helmholtz equation
in 2-D polar coordinates for a few frequencies.
In this paper, we review the ray validity conditions, which are
important to understand the advantages and shortcomings of the ray tracing
methods. We have computed Green's functions
with the paraxial ray tracing method in the smoothed Marmousi model.
The ray validity conditions were not fulfilled, even in the smoothed model.
However, the paraxial ray tracing method was still able to compute reasonable
and accurate traveltimes for multiple arrivals.
We have experimented with both a constant length
smoothing operator, and an operator with length equal to the
wavelength of a center frequency of 30 Hz. Smoothing is preferred, not only
to make the model more ray valid, but to make the ray tracing solutions
more like band-limited solutions,
e.g, Biondi .
We demonstrate, with finite difference modeling, what effect smoothing of
the model has on a high frequency wavefield.
We use the images, obtained from feeding
the Green's functions into a Kirchhoff prestack depth migration algorithm,
to evaluate the performance of the paraxial ray tracing solutions.
Because high frequency finite difference modeling demonstrates
that different arrivals often interfere, we use a
simple technique to merge interfering ``ray-arrivals'' into one.
This technique reduces some of the high frequency noise in the images.
RAY METHODS AND THEIR VALIDITY CONDITIONS
Asymptotic ray methods are based upon the high frequency assumption, i.e.
both the structure and the amplitude of the wavefront are assumed to be
slowly varying over a wavelength. In seismic applications, this condition is
often violated. Ben-Menahem and Beydoun and Beydoun
and Ben-Menahem have given a rigorous
study of the ray methods validity conditions in an elastic isotropic medium,
and they defined several conditions that should be fulfilled: 1) The
mode decoupling condition expresses the condition for decoupled P- and
S-waves. 2) The high frequency condition expresses when the
traveltime can be computed from the eikonal equation. 3) The cumulative
error condition expresses how far in traveltime a ray is accurate, which
is also called the Fresnel condition. For paraxial rays, Ben-Menahem
and Beydoun also introduced the
paraxial condition and the regularity condition.
In the paraxial ray tracing the solution is computed for points on, and also
in the vicinity of, a central ray.
We use the two latter conditions to decide how far from a central ray the
paraxial solution is valid. Here we give a
brief review of the ray validity conditions and discuss their importance.
In an isotropic medium, the elastodynamic equation can be written as:
|  |
(1) |
e.g. Ben-Menahem and Beydoun .
Here,  denotes the displacement vector,
  and
and  are the Lamé elastic coefficients,
  is density and
  is
the unity dyadic. We take the divergence and the curl of equation Elasto.
Next we Fourier transform the expressions, and
keep only first order terms of
  ,
,  , and
, and  where
where
|  |
(2) |
 and
and  denote P- and S-velocity, and
  is density.
The first order terms of
  ,
,  , and
, and  give us coupled
equations for the P- and S-wavefields. In ray theory, we assume that the
far-field P- and S-waves are totally decoupled and neglect all terms with
 ,
,  , or
, or  as a factor.
Ben-Menahem and Beydoun defines the condition for
this simplification the mode decoupling condition:
|  |
(3) |
where  denotes the frequency, and
  is called the cut-off
frequency. Note that, at a physical boundary,
  goes to infinity.
This can be interpreted as P- and S-waves being coupled for all
frequencies at such interfaces. To overcome this, several ad hoc methods are
introduced to
use ray tracing in layered media, such as Snell's law, transmission/reflection
coefficients, the phase matching and ray parameter matching method,
e.g. Cervený . If we assume that P- and
S-velocities are decoupled, the scalar
Helmholtz equation can be applied to compute the acoustic pressure field.
Comparisons of finite difference elastic and finite difference acoustic
modeling in the Marmousi model show that traveltimes are only slightly effected
by the coupling, while the amplitudes are severely affected.
In the following, we will only consider pressure field solutions of the
scalar Helmholtz equation. We will also omit the density from the
equations in the discussion below.
The Helmholtz equation is here given in a general orthogonal
coordinate system
  ():
():
| ![\begin{displaymath}
{ 1 \over h_\tau h_1 h_2 } \biggl[ {\partial \over \partial ...
...iggr ] + { \omega^2 \over \alpha^2 }\psi = 0
\EQNLABEL{Helmhol}\end{displaymath}](img17.gif) |
(4) |
In the following we define  as the traveltime along the ray path.
A solution to the Helmholtz equation expanded as ray series assumes that
the traveltime is independent of the the amplitude:
|  |
(5) |
Ben-Menahem and Beydoun showed that instead assuming
|  |
(6) |
as a solution to equation Helmhol gives the following phase term:
|  |
(7) |
where
|  |
(8) |
 is called the cut-off frequency. The eikonal solution is only
valid for frequencies much higher than the cut-off frequency.
This condition can be formulated as
|  |
(9) |
which is defined as the high frequency condition.
The error in traveltime is cumulative, which is expressed in the
cumulative error condition,  , which
Menahem and Beydoun also defines as the
Fresnel condition. It is not sufficient to assume that the medium
is slightly varying over a wavelength. Seismic waves are hyperbolic in nature.
This means that the zone behind the wave that will influence a particular
point on the wavefront, gets larger the further the wave propagates.
For example,
even a topography on the core-mantle boundary with a wavelength of several
100 km might give diffraction effects on the recorded PcP-wavefield at the
surface for a wavelength of about 10 km (). A more
intuitive way to express the Fresnel condition, is that the medium must vary
only slightly within the 1st Fresnel zone, e.g. Kravtsov and Yorlov
.
In ray tracing the solution is
approximated with the zeroth order term in the ray series Rayseri.
Inserting this solution into equation Helmhol gives:
| ![\begin{displaymath}
\biggl ( \nabla^2 + { \omega^2 \over \alpha^2} \biggr ) \psi...
...cdot \nabla \tau \biggr ] \biggr \} \psi = 0
\EQNLABEL{Helmray}\end{displaymath}](img26.gif) |
(10) |
The real and imaginary parts of
equation Helmray define a system of coupled equations.
Since the coupled equations are non-linear, their numerical
solution is computationally expensive.
The equations are decoupled when the term with the Laplacian of the
amplitude can be neglected.
The real part
yield the eikonal equation, whose solution gives the ray-paths and
the traveltime:
|  |
(11) |
The zeroth
order amplitude can be computed by solving the transport
equation, that is derived from the imaginary part in the Helmholtz
equation,
| ![\begin{displaymath}
\biggl [ \nabla^2 \tau + 2 { \nabla A_0 \over A_0} \cdot \nabla \tau \biggr ] \psi = 0
\EQNLABEL{Transport}\end{displaymath}](img28.gif) |
(12) |
The simplification of the solution of equation Helmray is
at the expense of its accuracy for waves propagating
with frequencies around or lower than the cut-off frequency.
The efficient solution of equation Helmray for band-limited
data is an open research topic. In the following
sections, we explore the accuracy of an approximation to
the band-limited solution obtained by smoothing the velocity model.
Although, this approach is very simple and mainly based on an heuristic
link to the concept of the Fresnel zone, it improves
the accuracy of the results.
Solving equations Eikon and Transport
gives the
following solution, e.g. Ben-Menahem
and Beydoun
|  |
(13) |
where sub-index 0 denotes values at the source location, and J is the
geometrical spreading factor.  is the traveltime from source to
receiver, and it is computed by solving the eikonal equation. The geometrical
spreading factor is a solution to the transport equation.
The rays can be computed from the following equations, e.g. Cervený
:
|  |
(14) |
|  |
(15) |
where  is a point on the ray and
  is a slowness vector, both
are given in global Cartesian coordinates.
To compute the traveltime at points in the vicinity of the central ray,
we must compute the wavefront curvature. For this purpose it is convenient
to introduce two new coordinate systems: the ray-centered coordinate system,
which is a curvilinear coordinate system  that follows
the rays,
and the ray coordinate system
  where
where  and
and
 can be the rays take-off angles at the
source. A system of first order linear differential equation for the solution
of the eikonal equation in the ray-centered coordinate system, can be
obtained by applying a paraxial approximation to this equation
():
|  |
(16) |
where
|  |
(17) |
and
|  |
(18) |
Hence,  is the transformation matrix from ray to ray-centered
coordinates, and it can be shown that
  ,
().
pI is the slowness in ray-centered coordinates. The second derivatives
of the traveltime is given by Cervený .
|  |
(19) |
where
|  |
(20) |
Since the rays are
orthogonal to the wavefront, the traveltime in the vicinity of the central
ray can be approximated as:
|  |
(21) |
Another way to obtain the approximate traveltime in the vicinity of the
ray is to approximate the Helmholtz equation with the one-way parabolic
equation. Ben-Menahem and Beydoun showed that
the condition for this
approximation is that the distance from the central ray should be
much less than the radius of wavefront curvature. Assume that the
ray-centered coordinate system is oriented so that  is a diagonal
matrix, then the paraxial condition can be expressed as
|  |
(22) |
Another condition that is important is the regularity condition:
|  |
(23) |
where KR is the curvature of the ray. This condition is important to
secure a unique traveltime in the vicinity of the ray.
The ray methods are far-field approximations, and both the amplitude and
the unit slowness vector must be slowly varying. This condition is expressed
in the far-field condition:
|  |
(24) |
The paraxial ray tracing solution of the pressure field can be written as:
():
|  |
(25) |
Sub-index denotes value taken at the source. C is a factor dependent upon
the source, and is constant along the ray.
IMPLEMENTATION OF THE PARAXIAL RAY TRACING METHOD
In 2-D, the 14 kinematic and dynamic ray equations defined in equations Kineq1-Dynameq, reduce to 6. We chose a
Runge Kutta method to solve the 2-D kinematic and dynamic equations.
A bicubic spline representation is used for the P-velocity model.
A more efficient choice would have been to represent the velocity model
with constant gradient slowness- or velocity-field within triangles.
(). Then the ray equations can be solved analytically.
Also other velocity representations that give analytical solution, exist.
The paraxial and the regularity condition were used to find the maximum
distance from the central ray where the solution was valid. An upper limit
of this distance was set to 250 m. This was done to avoid problems in
situations where the ray is
straight and the wavefront curvature, computed from the second derivatives of
traveltime in equation Hessian, is zero. Then the regularity and
paraxial validity conditions are not sufficient to limit the region of
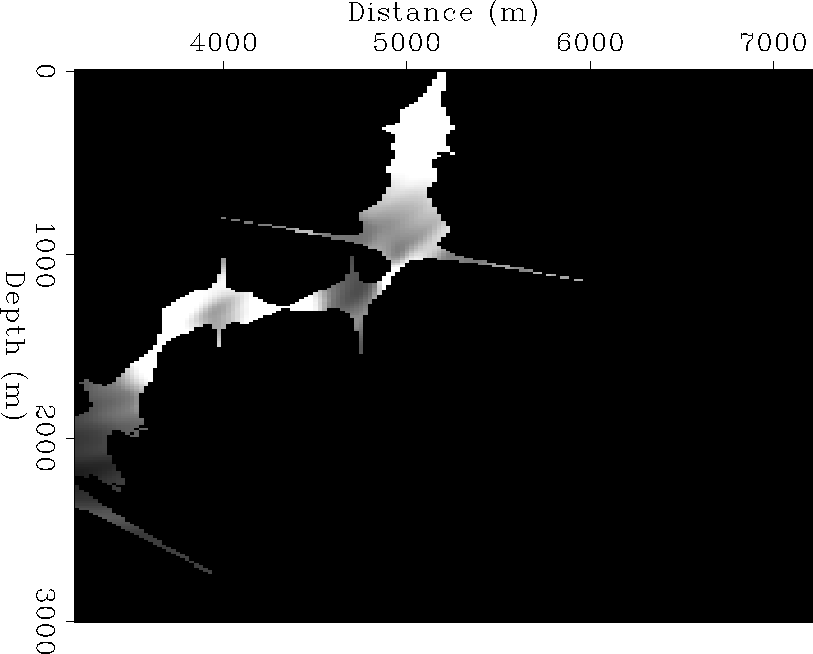
validity. Figure one-ray shows an example of where the solution is
valid according to conditions Paraxial and Regularity: the
left-hand sides of the these inequalities were set to be less than 10 percent.
The figure shows the amplitudes variations, computed along the central ray,
within this region. The solution cannot be valid in the outer parts of this
region, since a neighboring central ray will give another result here.
The paraxial and regularity conditions are also approximations that are only
valid in the vicinity of the central ray.
one-ray
Figure 1 Paraxial amplitude solutions from a
ray within its apparent paraxial and regularity validity region.

Since there are shadow zones, our implementation of the paraxial ray tracing
always computes one arrival-time, even if that solution don't fulfill the
paraxial or the regularity condition. If the distance between two neighboring
rays exceeds a limit (75m in our experiments), a new ray was computed from
the source with take-off angles in between. One or two of the most energetic
arrivals, computed from rays closer than a distance of 1.5 times
the distance from the actual point to the nearest ray, were picked.
Traveltime, amplitude, and phase, were stored for each pick.
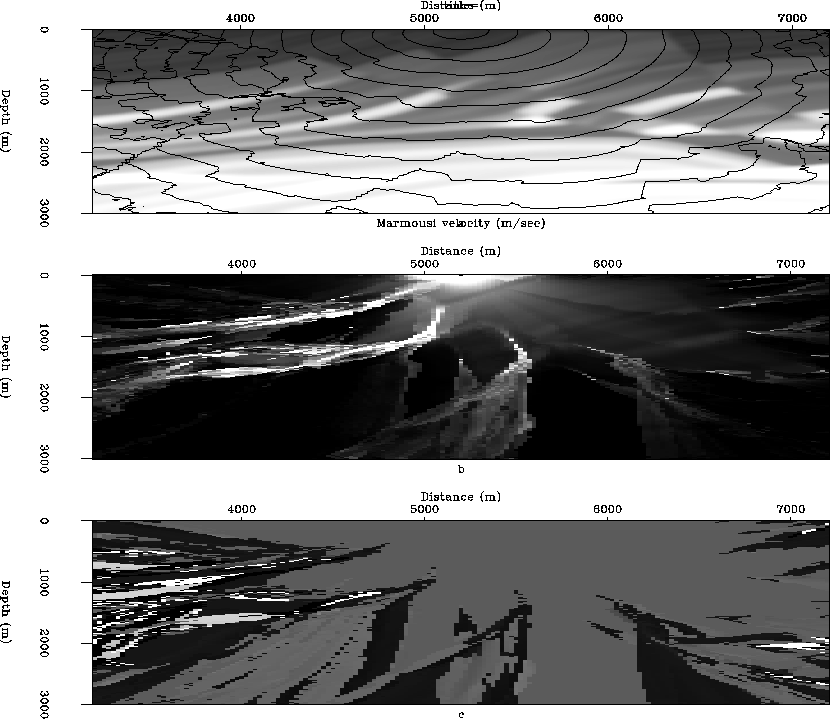
Figure Green-tab shows the Green's functions computed with the
paraxial ray tracing in the Marmousi model. The most energetic arrival
has been picked. The source was located at the
surface, with a distance of 5200 m from the left edge of the model.
We clearly see that the traveltime functions are discontinuous. And for
rays that pass through caustic regions, the amplitudes become far too high.
In one implementation of the program, in which two arrivals near in time were
merged together, we assumed a center frequency of 30 Hz to determine if
two arrivals with different phases interfere. We assumed that the pulses
had the simple form of a cosine with a sine as its Hilbert transform.
If the pulses interfere, a new amplitude, phase, and traveltime were computed
from the merged arrival. This allows us to operate with phase shifts that
are not only in integer multiples of  . This is demonstrated
in Figure Green-tabc where we see more variations of the phase.
Green-tab
Figure 2 A Green's function solution in
the smoothed Marmousi model. a) Traveltime contours laid over a
part of the smoothed Marmousi model (0.1s distance between isochrons)
b) Amplitudes for the most energetic arrivals. c) Phase shifts.

GREEN'S FUNCTION COMPUTATIONS
In this section, we have compared results of modeling with a 2-way finite
difference method and the paraxial ray tracing method.
Figure fd-seismo shows synthetic seismograms recorded at the surface
for a shot location at
depth 2500 m and 6000 m from the left edge of the model. The
seismograms were computed with a two-way acoustic finite difference program.
In Figure fd-seismoa, the seismic bandwidth was used. In
Figure fd-seismob
a high frequency bandwidth was chosen to simulate a high frequency method
behavior in the model. We see some shadow zones in the wavefield, and the
energy is distributed differently. We see more arrivals, and some of the
high-energy late arrivals are not as clear as in the low-frequency solution.
Figure fd-seismoc was obtained in a smoothed version
of the Marmousi model. The model was smoothed using a triangle smoothing
operator with a fixed length of 200 m. The smoothing reduced the number of
arrivals, and made the dominating arrivals more clear. The solution became
more like the seismic frequency band solution. Based upon a heuristic
idea of smoothing over the local Fresnel-zone, we also applied a smoothing
operator with a variable length. In Figure fd-seismod, a Gaussian
operator with a half-width equal to the wavelength for a center frequency of
30 Hz was used to smooth the slowness field. This resulted into a smoother
wavefield than when we smoothed over a constant length operator: the energy
distribution is different. Note however that the traveltimes are more or
less the same.
fd-seismo
Figure 3 Finite difference shot gathers
in the Marmousi model. The source is located in the target zone.
a) A finite difference solution with bandwidth 15-50 Hz, b) A finite difference solution with bandwidth 80-200 Hz, c) As in b, but in a smoothed model. The
model is smoothed with a constant triangle operator. d) as in c, but the
model is smoothed with a variable length operator.
 sm-comp
Figure 4 Traveltime, amplitude, and phase values
for the two most energetic arrivals computed with paraxial ray tracing. The
values are computed for sources at the surface with arrivals in the
target zone. Left hand side: values computed in smoothed model with
a constant length smoothing operator. Right hand side: Smoothed with the
variable length operator. The traveltimes are laid over the figure shown in
fd-seismoa. Circles with white on top of black represents the
most energetic arrivals.

In Figure sm-comp, the traveltimes, amplitudes and phases are plotted
for the two most energetic arrivals. The arrivals were obtained by
picking the traveltime values obtained by shooting from different
locations at the surface. They are computed from the paraxial
ray tracing method in the smoothed versions of the Marmousi model.
Note, that only in some areas has the program detected more than one arrival.
We see that the paraxial approximation is quite
successful in computing the most energetic arrivals, even in a rough model
such as the Marmousi. The most significant difference between these two
kinds of smoothing is the amplitude changes. And the amplitudes determine
which traveltimes are the most energetic. This result implies that a
better way to smooth the model, might improve the amplitude calculation.
IMAGING OF THE MARMOUSI MODEL
The Marmousi dataset was generated at the Institut Français du
Pétrole, and used for the
workshop on practical aspects of seismic data inversion at the
1990 EAEG meeting in Copenhagen, where contractors,
universities, and oil companies tried to determine a correct image from this
data set.
The geometry of the Marmousi is based on a profile through the North
Quenguela in the Cuanza basin. The target zone is a reservoir located
at a depth of about 2500 m (). The data
set consists of 240 shots with 96 traces per shot. The shot and receiver
spacing are 25m, and the near offset is 200 m. The first shot position was located at 3000 m. Recorded time was 2900 ms, with a sampling interval of 4 ms.
The Green's functions computed from each shot and/or receiver location were
pre-calculated with the paraxial ray tracing program described above. The
traveltime, amplitude, and phase values were stored at grid-points, with
12.5m spacing in depth and 25m spacing in the horizontal direction. Values
for 2000 m in each horizontal direction from each surface location and
3000 m in depth were stored. The imaging was done with a Kirchhoff
prestack depth migration algorithm.
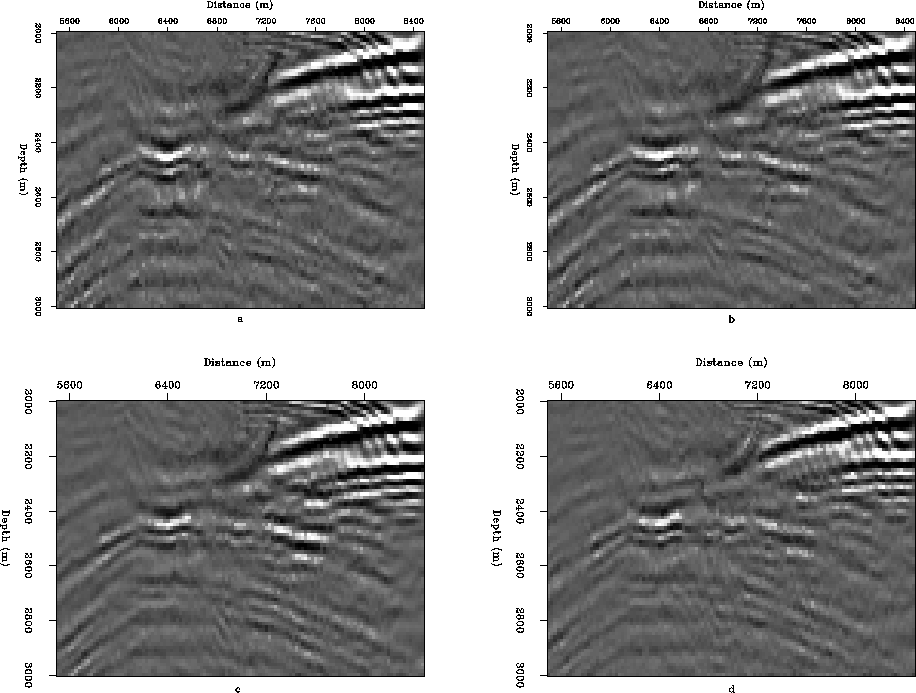
Figure close-up shows close up images of the target obtained from
different implementations of the paraxial ray tracing code, and different
smoothing of the model. First, the slowness field was smoothed over a constant
length triangle with a baseline of 200 m. Amplitude, phase, and traveltime
information are used. Figure close-upa is computed using the
most energetic arrival. We can clearly see the reservoir. However, the
image is a bit blurred, and the target zone is not flat.
In Figure close-upb, the two most energetic arrivals were used.
We see that the target zone becomes more flat and visible.
In Figure close-upc, the merging of phases technique is used when we
compute the most energetic arrival. This technique remove much of the high
frequency noise in the image. The variable length smoothing operator was
used in Figure close-upd for the most energetic arrival, and this
also resulted in a more flat target-zone. Also here was the
merging of phases technique applied.
close-up
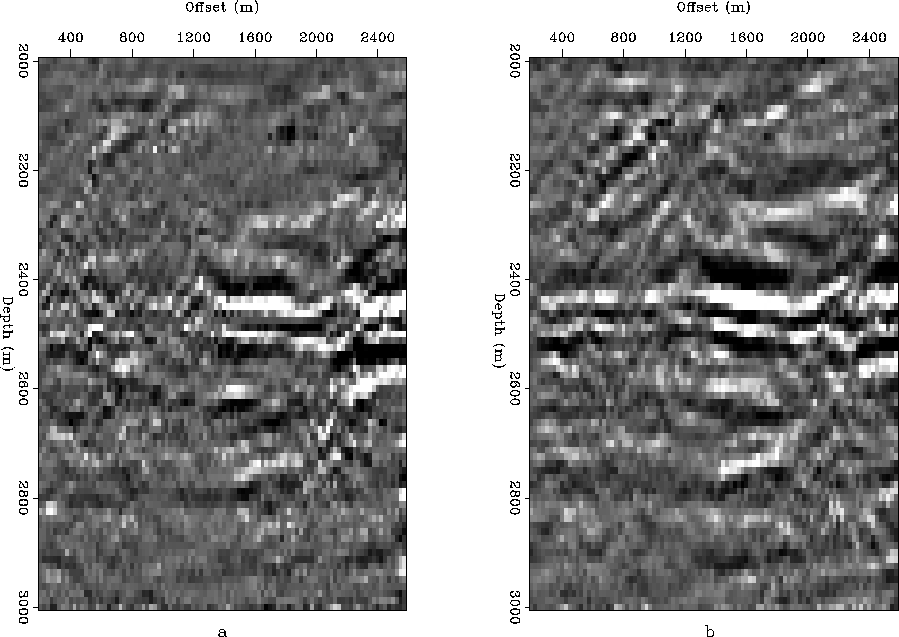
Figure 5 Close up images
of the target zone in the Marmousi model. a) The most energetic arrival has
been used. b) The two most energetic arrivals have been used. c) The most
energetic arrivals and the merging of phases technique have been used.
d) As in c, but a variable length smoothing operator has been used.

In Figure images-1, we show the difference in the
images obtained just by using the most energetic arrival and the
image obtained using the merging of phases technique, variable length
smoothing and the two instead of the one most energetic arrivals.
The merging of phases technique removes a lot of the high-frequency noise in
the figure. Using two instead of one arrivals flattens the image of the
reservoir,
and the base of the reservoir becomes more visible. The variable-length
smoothing operator also improves the image.
images-1
Figure 6 Images of the Marmousi model.
Amplitude, phase, and traveltime informations have been used.
a) Obtained using the most energetic arrivals in the constant length smoothed
model. b) Obtained using the two most energetic arrivals combined with the
merging of phases techniques in the variable-length smoothed model.

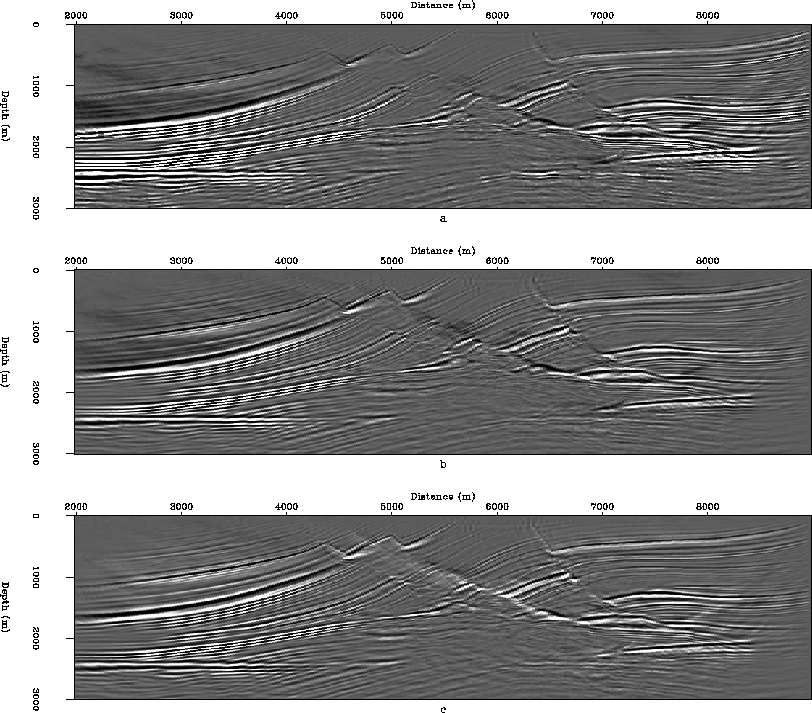
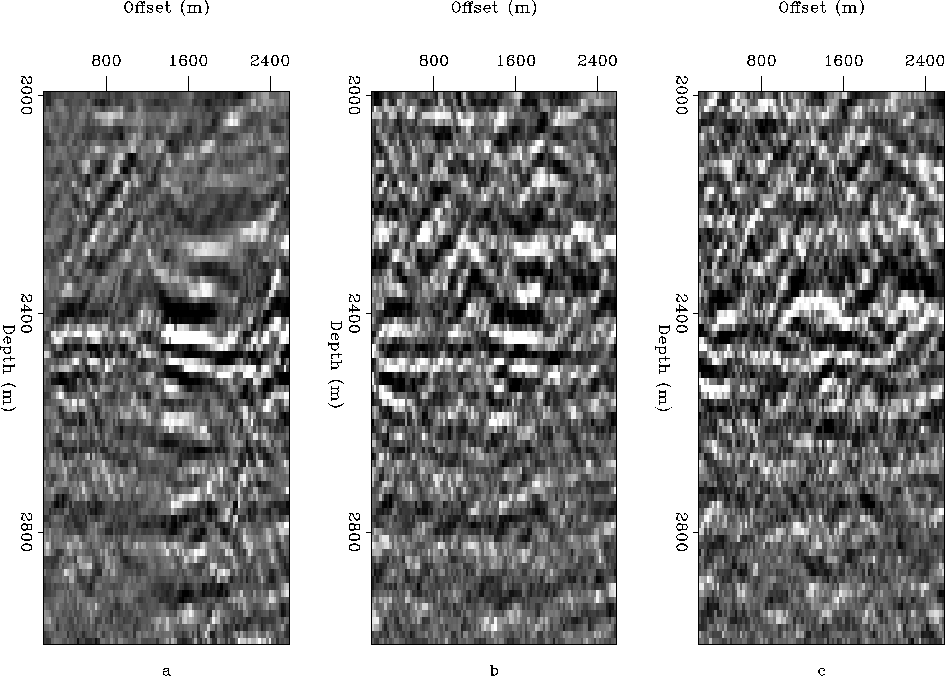
In Figure images-2, we demonstrate that the amplitude and phase
information computed from paraxial ray tracing is important. The amplitudes
can not only be used to determine which arrival is the most energetic,
but using Green's functions that have amplitude and phase, in addition to
traveltime information, improve the image significantly.
The merging of phases technique was applied to compute the most energetic
arrivals with amplitude, phase, and traveltime values. The images demonstrate
the improvements made in also exploiting phase and amplitude information.
Also using both phase and traveltime improved the quality of the image
compared to using traveltime only.
images-2
Figure 7 Images of the Marmousi model
using the most energetic arrivals. a) Using amplitude, traveltime, and phase
b) Using traveltime and phase, c) Using traveltime only.
The variable length smoothing operator was used.

The differences are more visible, when we see what will be summed in the
migration algorithm. In Figure crp-amp, the common reflector points
image for the surface position 6450 m is shown for the two images in Figure images-1.
In the best result obtained, the reflected energy at the target zone
is much more coherent over offset than in the case where we just used the most
energetic arrival in a model with a constant smoothing operator. This is
most obvious for the near offsets. The values are obtained by
stacking over the common offset diffraction hyperbolas, and dividing by the
sum of the multiplied source and receiver Green's function amplitude over
the same hyperbola. In our amplitude calculations, we did very little to
correct for far too-high amplitudes due to caustics. Hence, a
very high amplitude with a wrong phase could distort the image.
crp-amp
Figure 8 Common reflector points for
depth locations in the target zone, for the same images as in
Figure images-1.

Figure crp-tpa clearly demonstrate the improvements possible by
exploiting amplitude and phase information in the Green's function. In the
case of traveltimes only, we can hardly see the target. When we exploit
traveltime and phase information, the coherency at the target zone
improves significantly. Even if the target zone becomes much clearer when we
exploit traveltime, phase and amplitude, we loose
some of the coherence at the target zone ( Figure crp-tpaa). The
only difference between Figures crp-tpaa and crp-tpab is the
amplitude factor in the summation. This suggests that a better control of the
amplitude near caustics is important.
crp-tpa
Figure 9 As in Figure crp-amp, but
for a) traveltime, amplitude, and phase, b) traveltime and phase, c) traveltime only.

CONCLUSIONS
In this paper, we have studied the potential of using the paraxial ray
tracing method to compute Green's functions in rough models,
where the ray validity conditions are not fulfilled.
Finite difference modeling in a smoothed Marmousi velocity-model
shows that the high frequency wavefield (80-200 Hz) is closer to
the band-limited wavefield around 20-60 Hz in the un-smoothed model.
Hence, proper smoothing can lead to a ray solution closer to a band-limited
solution. Experiments with the paraxial ray tracing in smoothed Marmousi
models demonstrate that this method is able to compute the traveltimes fairly
accurate, and that the amplitude is accurate enough in most cases to
successfully pick the most energetic arrival. We found that the
amplitudes were more sensitive to the smoothing than the traveltimes.
The images demonstrate that exploiting amplitude and phase
information together with the traveltimes, improves the quality of the
images. Comparisons of common reflector point gathers obtained from
exploiting amplitude, traveltime, and phase and exploiting
traveltime and phase,
suggest there is a potential for an improved result by better control of
the amplitudes near caustics. We also introduced a technique to merge two
arrivals near in time into one, if they interfered. Results demonstrate that
this merging of phases technique reduces much of the high frequency noise
in the images.
Using the two most energetic arrivals instead of just the most energetic
arrivals improved the image of the target zone. Smoothing of the slowness
field over one wavelength of the center frequency, instead of applying a
constant-length smoothing operator, also improved the image.
The most significant improvement was from the merging of phases
technique combined with a variable length smoothing operator. The experiments
with the simple smoothing operators used here, demonstrate the need for
further research on that topic.
We wish to thank Dave Nichols for many helpful discussions, and to
provide us with his migration code.
[mybib]


![[*]](http://sepwww.stanford.edu/latex2html/prev_gr.gif)


Next: About this document ...
Up: Table of Contents
Stanford Exploration Project
5/15/2001
![[*]](http://sepwww.stanford.edu/latex2html/prev_gr.gif)
![]() that follows
the rays,
and the ray coordinate system
that follows
the rays,
and the ray coordinate system ![]() where
where ![]() and
and
![]() can be the rays take-off angles at the
source. A system of first order linear differential equation for the solution
of the eikonal equation in the ray-centered coordinate system, can be
obtained by applying a paraxial approximation to this equation
():
can be the rays take-off angles at the
source. A system of first order linear differential equation for the solution
of the eikonal equation in the ray-centered coordinate system, can be
obtained by applying a paraxial approximation to this equation
():
![]() . This is demonstrated
in Figure Green-tabc where we see more variations of the phase.
. This is demonstrated
in Figure Green-tabc where we see more variations of the phase.



![[*]](http://sepwww.stanford.edu/latex2html/prev_gr.gif)