![[*]](http://sepwww.stanford.edu/latex2html/prev_gr.gif)
ABSTRACTSeveral methods for predicting the relationship between the velocity and the liquid-water-to-water-ice ratio in permafrost are derived and examined, including a modification of the Voigt average for three materials based on critical porosity. Field seismic techniques for detecting anomalous velocity or attenuation changes are reviewed in view of the unique wave propagation problems encountered in permafrost areas. |
Permafrost covers much of the Earth's colder regions, and affects the seismic imaging of the subsurface as well as activity on the surface. The presence and structure of permafrost is ideally determined with seismic methods to avoid using invasive methods such as drilling that cause significant environmental damage. One interesting property of permafrost that should be detectable with seismic methods is the amount of unfrozen water.
In this paper, I present several methods of predicting seismic velocities as a function of the amount of unfrozen water in permafrost. Field seismic methods for mapping permafrost and determining its properties are also suggested.
The expected structure and some of the properties of permafrost are reviewed. Alternate estimates of the ice fraction versus velocity relationship shown by Timur are given. Seismic reflection surveys, refraction surveys, and Kjartansson's technique for detecting attenuating zones are compared. A synthetic example is processed with Kjartansson's technique to show the results of simple structures.
THE EXPECTED STRUCTURE AND PROPERTIES OF PERMAFROST
Permafrost structure
Permafrost occurs in forms that vary from layers hundreds of meters thick to scattered patches of buried frozen earth. Williams and Smith give an estimate that about 25 percent of the land surface of the earth contains some permafrost. Except for the extremely cold, far northern regions, most permafrost contains a significant amount of liquid water, since the water within the soil does not freeze until it is significantly colder than the freezing temperature of pure water. Frozen soil can pull water away from nearby areas with excess liquid water to create concentrations of water ice that contain much more water than the original saturation of the soil could account for, creating structures such as dingos and palsas(). These variations of water content affect surface activities such as construction on permafrost as well as seismic imaging through the permafrost.
Although the average air temperature has the greatest effect on permafrost structures, local conditions such as vegetation, snow cover, the presence of rivers and lakes, the water table(), and soil conductivity() cause variations in the depth and properties of the permafrost. Therefore, in areas that are not extremely cold, the depth and temperature of the permafrost is likely to be highly variable.
Several issues make techniques for determining the structure and properties of permafrost important. For seismic prospecting, an irregular permafrost distorts the reflection images of the deeper subsurface. This distortion could be removed if the detailed structure of the permafrost layer was available. Also, a knowledge of the properties of the near surface is desirable for construction projects in areas with permafrost. Finally, as oil reserves dwindle, operations in the relatively unexplored far north are likely to become more common, and permafrost properties of more interest.
Velocity and attenuation in permafrost
Seismic velocities in permafrost are temperature dependent; they increase as temperature decreases(). The sharp rise in the velocity at the freezing temperature of water continues until the temperature falls to about -20 degrees Celsius, where it gradually levels off. This trend is probably caused by partial freezing of the liquid water. As the temperature drops, the fraction of water that is liquid decreases until, when the rock is very cold (less than -20 degrees Celsius), almost all of the water in the rock is ice. This appears to hold even when the ice contains no dissolved salts. The velocity becomes almost constant when no more liquid water exists. This sensitivity of velocity to temperature and the relationship of temperature to the amount of liquid water the rock contains may make velocity a useful diagnostic for the liquid-water content of the rocks in field experiments.
An alternative diagnostic of the amount of liquid water in permafrost is the attenuation caused by the squirt-flow mechanism. The attenuation is likely to be difficult to measure since it will generally occur at frequencies higher than the typical frequency range of 5 to 100 Hz used in field work, although it might be useful for fairly shallow investigations. The shape of the liquid inclusions causing the attenuation determines the range of frequencies needed to detect the attenuation. For example, if the liquid water tends to form large spherical pores, the squirt flow attenuation mechanism will be less effective than if the liquid water exists in long narrow cracks.
Velocity versus ice fraction predictions
Since predicting the liquid-water content of the permafrost from the velocity may be useful, I present several attempts at estimating the velocity of a rock, ice, and liquid-water mix. In the example that follows, the material is considered to be a mixture of quartz, ice, and liquid water, where the velocity of quartz is 6050 m/s for the P-waves and 4090 m/s for the S-waves. The density of the quartz is considered to be 2630 kg/m3. For water, the P-wave velocity is 1570 m/s and the density is 1000 kg/m3. Ice is considered to have the same density as water but with a P-wave velocity of 3310 m/s and an S-wave velocity of 1800 m/s. Following Timur, the porosity of the quartz matrix was set to 18.1 percent.
The Voigt average is an upper bound for elastic moduli. For three materials the Voigt average is
| (1) |
| (2) |
| (3) |
Hashin-Shtrikman bounds give somewhat narrower ranges the the effective elastic moduli of mixtures, but are more difficult to calculate. I followed the procedure given by Berryman . All these results are displayed in Figure Fig1. The lower Hashin-Shtrikman bound is equal to that of the Reuss limit and cannot be seen as a distinct line on the plot. The upper Hashin-Shtrikman bound is somewhat less than the Voigt limit. The Hashin-Shtrikman upper bound shows little sensitivity to the velocity.
I also attempted to a velocity prediction using a modified
Voigt average with the
critical porosity replacing the actual porosity ()
for a material composed of a mixture
of sand, liquid water, and ice.
The result is also shown in Figure Fig1.
An effective porosity of ![]() was used,
where
was used,
where ![]() is the porosity of the quartz matrix,
and Sice is the fraction
of water that is ice.
A modified porosity
is the porosity of the quartz matrix,
and Sice is the fraction
of water that is ice.
A modified porosity ![]() was used to modify
the Voigt average, where
was used to modify
the Voigt average, where ![]() is the critical porosity,
which was set to 40 percent in this case.
The modified material fractions in the Voigt average are
is the critical porosity,
which was set to 40 percent in this case.
The modified material fractions in the Voigt average are
| (4) |
| (5) |
| (6) |
| (7) |
 |
SEISMIC MEASUREMENTS OF PERMAFROST PROPERTIES
Standard reflection processing
The acquisition and processing of reflection data on a scale suitable for imaging permafrost structure is relatively well developed and is a scaled-down version of the reflection techniques used for oil exploration (, ).
While acquisition of a small survey will be less expensive than the cost of larger-scale operations, small scale surveys still require a significant amount of labor to acquire, especially if three-dimensional coverage is needed. The processing requirements of a small-scale survey will be similar to those of a larger survey, since the shot and detector spacing needed for the higher resolution generally expected from a small-scale survey balances the smaller acquisition area. Seismic processing tends to be slow and labor-intensive, plus it requires significant computational resources. However, good images of reflectors and accurate velocity fields are obtained in many cases.
A problem with standard seismic processing is that extracting rock properties is often not one of the main goals. Traditionally, structure, velocity, and reflection amplitudes have been emphasized, although these measurements are being extended with techniques like amplitude-versus-offset measurements, which is now being considered more often. Attenuation effects are seen more as confirmation of high reflection amplitudes or as corrections to the source wavelet in an almost constant-Q environment. This attitude is probably justified, considering the small frequency range and low-frequency signals used in typical surveys, but in examining shallow permafrost properties, higher frequencies and a wider frequency range may allow useful attenuation measurements.
Refraction surveys on permafrost
A traditional alternative to reflection seismology is the use of refraction events to map the subsurface. In the case of mapping permafrost, refraction surveying has two problems.
The first problem is that a permafrost layer has a higher velocity than the layers under it. In typical refraction work, velocities are assumed to increase with depth, and high velocity layers above low-velocity layers are invisible. This is because the seismic energy is refracted toward the vertical axis rather than being refracted toward the horizontal axis to follow the layer boundaries. Thus, a high velocity layer looks like a slight thickening of the adjacent low velocity layer.
The second problem is that refraction processing normally assumes that refractions travel along layer boundaries or across media with a smoothly increasing velocity function. These assumptions are generally used to simplify the processing of refraction data, although some authors (, ) have suggested a more general tomographic approach to the problem. While permafrost layers are generally horizontal, the variations in structure are unlikely to be as horizontal as they are in typical sedimentary cases.
In short, while refraction surveys are useful in many areas, the velocity structure of permafrost presents unique difficulties with this technique.
Surface-consistent measurements
As noted above, standard seismic processing tends to focus more on structure than on amplitudes, and little on the amplitudes of attenuation. As an alternative to the standard processing sequence, a technique suggested by Kjartansson and continued by Claerbout makes use of what was originally thought to be pure attenuation of seismic waves as they travel though the near-surface layer.
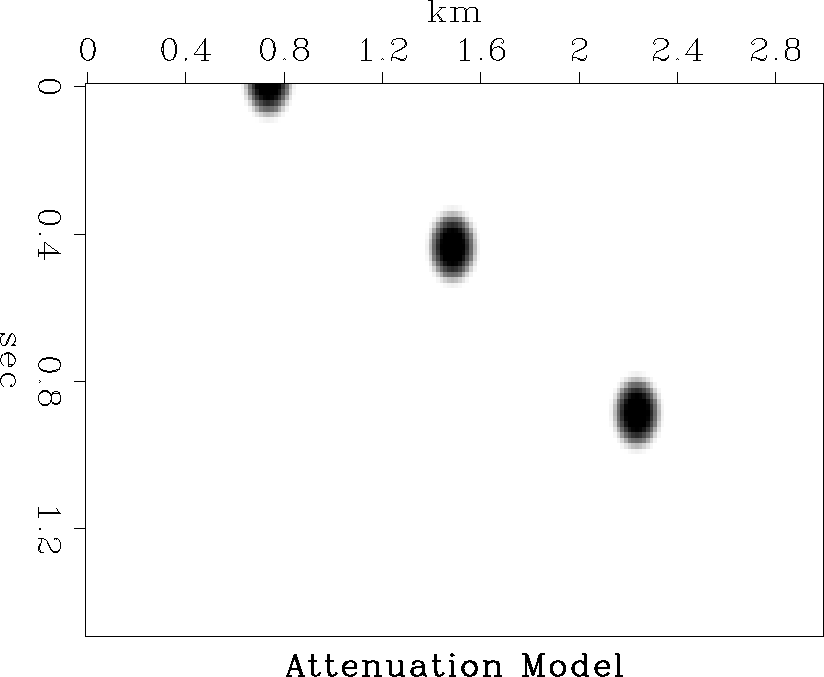
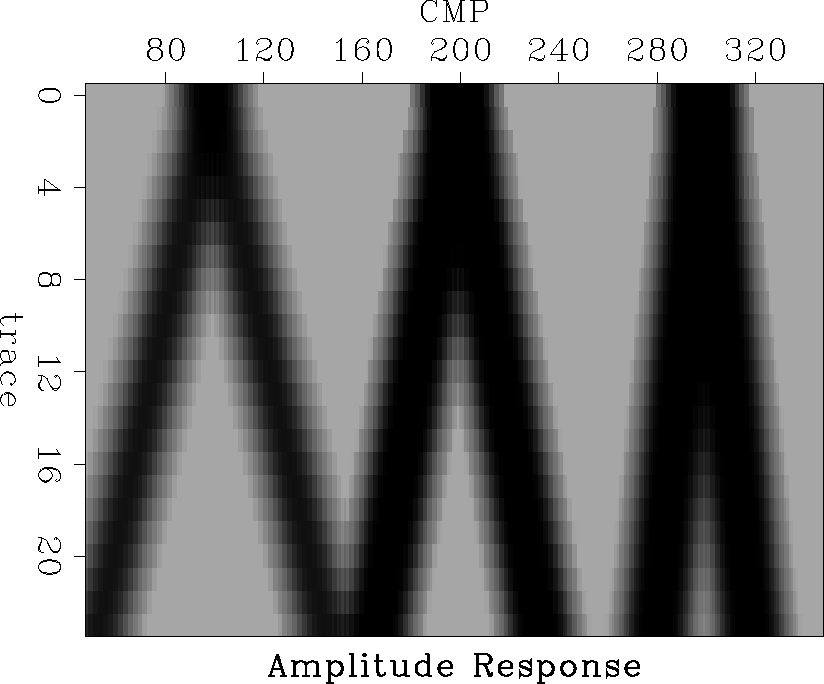
As an example of this technique, consider the model in Figure model1, which contains three attenuating zones and a reflector at the bottom. I built a synthetic dataset from this model using straight rays which originated at the surface and then were reflected back to the surface, while accounting for the accumulated attenuation along the ray path. Using Kjartansson's technique of getting the RMS amplitude of each trace, different attenuation patterns can be seen for attenuating events at different depths. These patterns are shown in Figure sumeq.
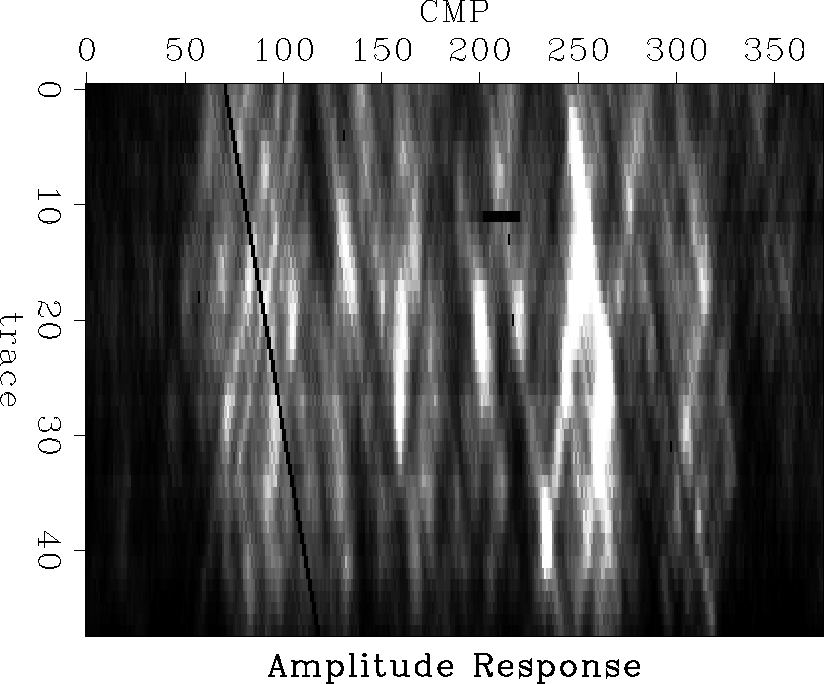
The detection of such patterns are no guarantee that attenuation is what is being detected. Velocity anomalies produce similar patterns in the absence of any attenuation. The similarity of these patterns make the separation of the two effects difficult. An example of these patterns are shown from Kjartansson's Gulf of Mexico dataset in Figure kjampx. The white diagonal line on the left side of the figure is a missing shot, which could be considered as a perfect attenuator located at the surface. While much of the energy on the plot forms the same angle as the line from the missing shot, some of the diagonal events show smaller angles, indicating either attenuation or velocity focusing at depth. Amplitude anomalies at the reflector should show up as vertical lines in Figure kjampx.
Kjartansson showed examples of his attempts to invert these surface-consistent amplitude patterns in his thesis. While some information was lost as expected with this technique, the results for the simple model in his thesis and for his Gulf of Mexico dataset look encouraging. The results have some obvious resolution limitations.
For finding areas of high liquid-water content in permafrost, the difference between actual attenuation and apparent attenuation caused by velocity anomalies is less important than might be supposed, since high liquid content causes both attenuation and velocity anomalies. The combination of the two effects may make the result difficult to quantify but easy to detect.
 |
 |
 |
Measurements using surface waves
Another possible method of detecting changes in the structure and properties of near-surface permafrost is to measure the velocity and amplitudes of surface waves as a function of frequency. Surface waves with low frequencies penetrate deeper into the earth than do high-frequency surface waves. By measuring the attenuation and velocity along a line, the attenuation and velocity changes with depth may be calculated. To restate this idea, the high-frequency arrivals sample the shallow subsurface and the low-frequency arrivals sample both the shallow and deep subsurface. Comparing the travel-times at different frequencies results in subsurface velocity and attenuation maps.
The resolution of this technique is likely to be poor, especially in the vertical direction, since the function of the attributes with depth is determined from broad weighting functions at each frequency. The depth of penetration will also be limited by the lowest frequencies used, while the attenuation may be best observed with high frequencies. While this idea may work for velocity determination, it is unlikely to be useful for attenuation measurements because of the limits to depth penetration for high-frequency signals needed for attenuation measurements.
Problems in oil exploration created by permafrost layers
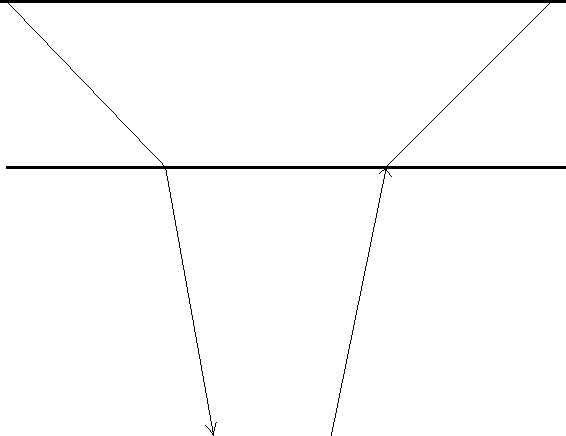
Near-surface layers can create significant distortions in wave fields propagating through them. For low-velocity weathering layers, the problem is simplified by assuming that the travel paths through the weathering are approximately vertical, as seen in Figure lowv. Since the weathering tends to have a much lower velocity than the deeper layers, and since reflection arrivals are close to vertical anyway, the assumption of vertical propagation through the weathering layer tends to be good. The distortion of the wave field may be corrected with simple time shifts of the seismic traces ().
|
lowv
Figure 5 Ray paths in a low velocity near-surface layer. |  |
When the near-surface contains permafrost, the velocity is generally higher than the velocity of the deeper layers, and the assumption that the ray paths are vertical fails, as is shown in Figure highv. Because the rays are bent toward the vertical at the base of the permafrost, much of the energy from the seismic source is focused into the area directly under the shot, making the far offset traces relatively weak.
|
highv
Figure 6 Ray paths in a high velocity near-surface layer. |  |
Finally, if the permafrost layer has a large reflection coefficient at its base, it can trap energy within the permafrost layer. As this energy leaks out, it creates a ringing on the seismic records.
CONCLUSIONS
Several estimates of the velocity versus the volume fraction of ice to liquid water are given. The Voigt average, modified with the critical porosity and ice fraction, and Wyllie's time average appear to be the two best predictions, although physical experiments will be needed to further validate the results.
Determining the structure and properties of permafrost layers, especially the liquid water content of the frozen soil seems possible for field work, since the seismic velocity is sensitive to the amount of liquid water present. Determining the amount of liquid water from attenuation effects may be more difficult, but might be possible in shallow permafrost where high-frequency signals can penetrate.
To determine the structure and properties of permafrost layers, standard reflection methods may be used, but these tend to be fairly expensive unless detailed information is needed. Refraction surveys are unlikely to be useful because of the decrease in velocity with depth in permafrost areas. Kjartansson's surface-consistent amplitude technique may have some application in getting low-resolution measures of scattering or attenuation, both of which give indications of the presence of areas with high liquid-water content.
ACKNOWLEDGMENTS
I would like to thank Jack Dvorkin for his suggestions and help. Jim Berryman helped with the Hashin-Shtrikman three mineral case. Thanks are also due to Luis Canales, Ron Chambers, and Thorbjorn Rekdal for their comments on this subject.
[mybib]
![[*]](http://sepwww.stanford.edu/latex2html/prev_gr.gif)