![[*]](http://sepwww.stanford.edu/latex2html/prev_gr.gif)
ABSTRACTWe present a new, far-field solution for approximating the transmission response through a set of thin layers. The method relies on a modification to the O'Doherty & Anstey solution to the transmissivity through a layered medium. We tested the new method on a real log and compared the results to the ODA solution. We show that the approximate solution is quite accurate and thus can be used to provide connections with the equivalent medium theory. |
The amplitude of reflections, especially relative amplitude, provides useful information for stratigraphic interpretation. Amplitude information, however, is not easily interpreted because of the numerous factors that affect it. In this work we are concerned with losses caused by transmission through a set of thin layers. A classical paper by O'Doherty and Anstey (1971) showed that the cascaded transmission loss through a great number of interfaces is significant. In geologic terms, they recognized two extreme types of stratification, shown in figures impedcyc and impedtrans as acoustic logs. The first log has high frequency variations in seismic impedance laid down by a cyclic pattern of sedimentation. The second log is the product of a transitional sedimentation process leading to a slowly-varying velocity function within basically thick layers. These two types of sedimentation patterns can be described through the autocorrelation function of their reflectivity series computed from the velocity and density logs. Figures autocyc and autotrans show the autocorrelation functions corresponding to the cyclic and transitional log, respectively. The important difference between the two types is that the first few values of the transitional autocorrelation are positive, whereas in the case of a cyclic sedimentation process, the second value of the auto-correlation is strongly negative. impedcycheight=2.5inSynthetic impedance log with cyclical deposition impedtransheight=2.5inSynthetic impedance log with transitional depostion autocycheight=2.5inAutocorrelation of the synthetic impedance log with cyclical deposition autotransheight=2.5inAutocorrelation of synthetic impedance log with transitional depostion
This reports presents a new way of approximating the transmission response through a set of thin layers. It is essentially a far-field approximation to the well-known result of O'Doherty & Anstey (hereinafter ODA). We compare the results of the ODA method and ours when tested on a real log of thin layers. First we describe the full ODA method and then show our modification of this method. We also describe the data preparation and explain the constraints of our model. TRANSMISSION RESPONSE THROUGH THIN LAYERS A Two-term approximation
The core of the O'Doherty/Anstey paper is a simple equation relating the transmissivity of a set of equal travel-time layers to the reflection sequence the layers generate. This equation is usefully given in a Z-transform notation which keeps one foot in the time domain and the other in the frequency domain.
The ODA result for the retarded transmissivity caused by propagation through a set of layers is:
![]()
![]()
![]()
![]()
![]()
![]()

![]()
Reflectity log from real data Here we treat the earth as a one-dimensional medium made from the superposition of many layers with varying acoustic properties. A seismic reflection is generated at every geological interface across which there is a contrast of acoustic impedance. The seismic impedance is defined as the product of density and velocity. Well log data can be used to construct a 1-D acoustic earth represented by a reflection coefficient series. For normal incidence, the reflection coefficient is given by
| |
(1) |
|
impedance512
Figure 1 Acoustic impedance series | 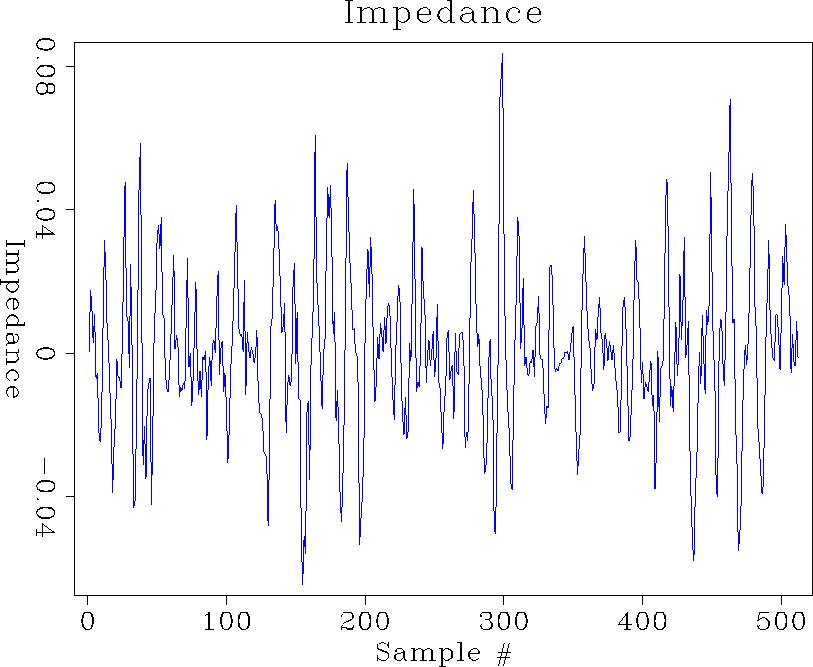 |
|
reflectivity512
Figure 2 Reflectivity series | 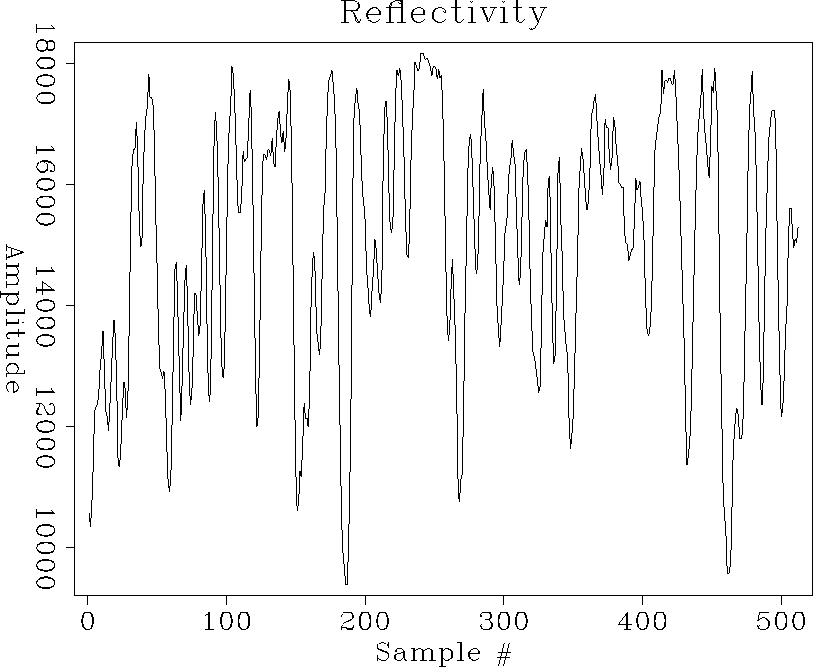 |
|
origauto
Figure 3 Autocorrelation of calculated reflectivity series | 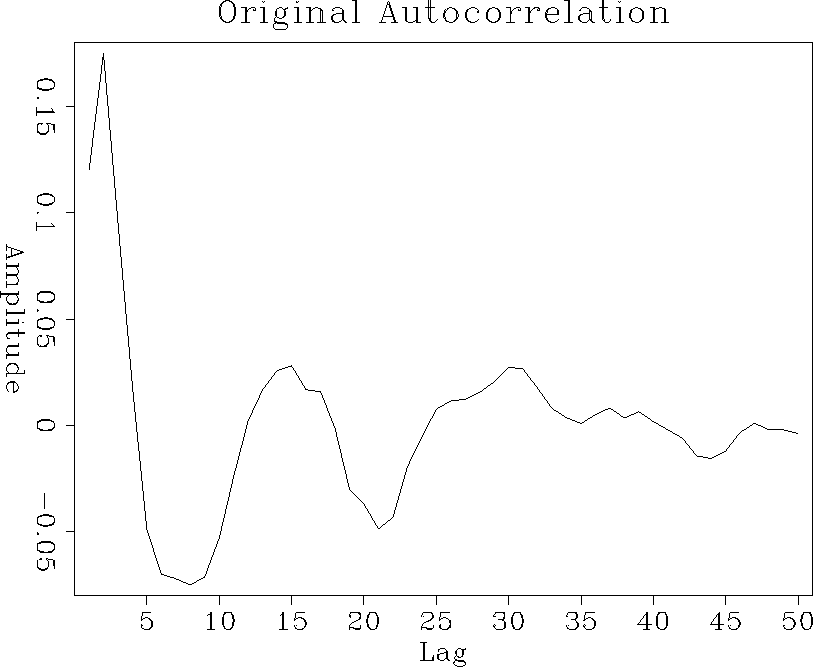 |
Constraints of the model
Physically, the autocorrelation function of a reflection series is related to the order of multiple reflections within the stratigraphic column. The value of the first lag represents the sum total of all the 2-bounce multiple reflections occurring in layers of one unit of thickness. The value at the second lag represents the sum total of all 2-bounce multiple reflections occurring in layers of two units of thickness. Values at higher lags represent 2-bounce multiples of longer periods (). We have restricted our study to values of the autocorrelation functions at small lags. We applied a tapering function to the autocorrelation function, which leaves the very first few terms intact whereas, higher lag values are replaced by a decaying exponential function. Our earlier assumption of stationarity imposes the constraint that the sum of all reflection coefficients over negative and positive lags sums up to zero.
| |
(2) |
 |
(3) |
|
dampauto
Figure 4 Autocorrelation of reflectivity series after applying the exponential taper | 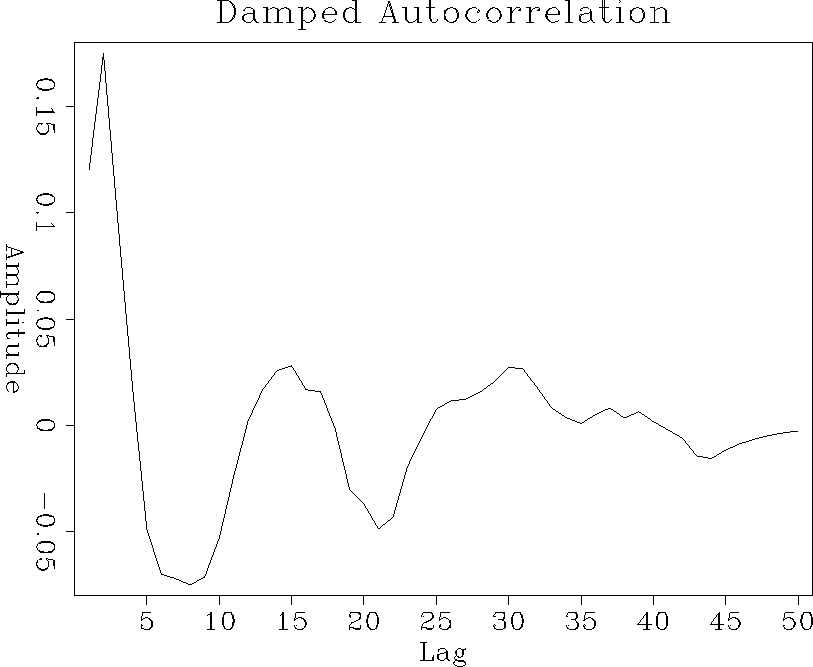 |
Results
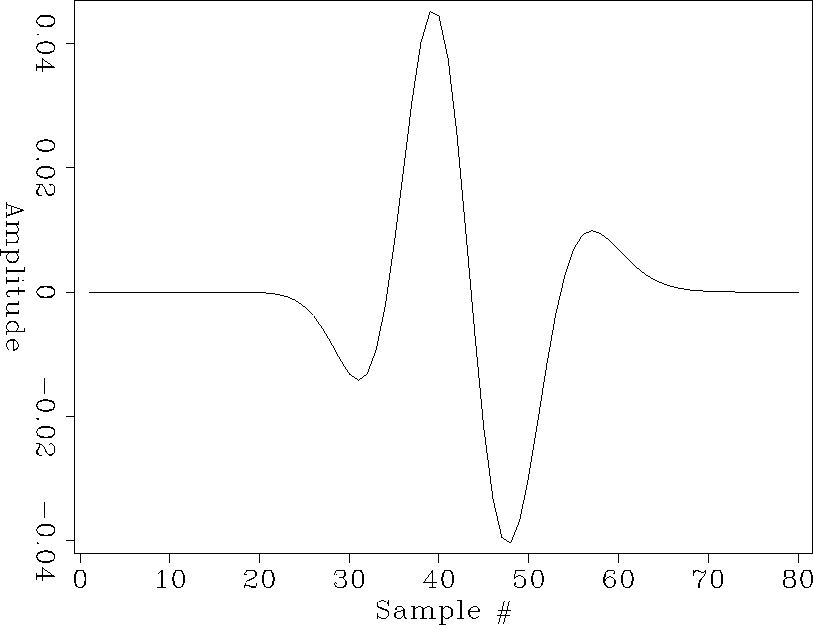
After adding the exponential tail to the autocorrelation, we computed the transmissivity using both the classical ODA approach and Muir's approximation. Figure total clearly illustrates that the approximation is sound. In both approachs the center of the pulse is around the 50th time sample and the Gaussian width/height ratio is approximately the same. The difference between the two approaches, shown in figure dif, is fairly small compared to the amplitude of the transitional responses (less than 5%) and has the shape of a first derivative of the Gausian. The shape indicates a small time shift between the Muir's approximation and the ODA solution.
 |
Remarks on the test data
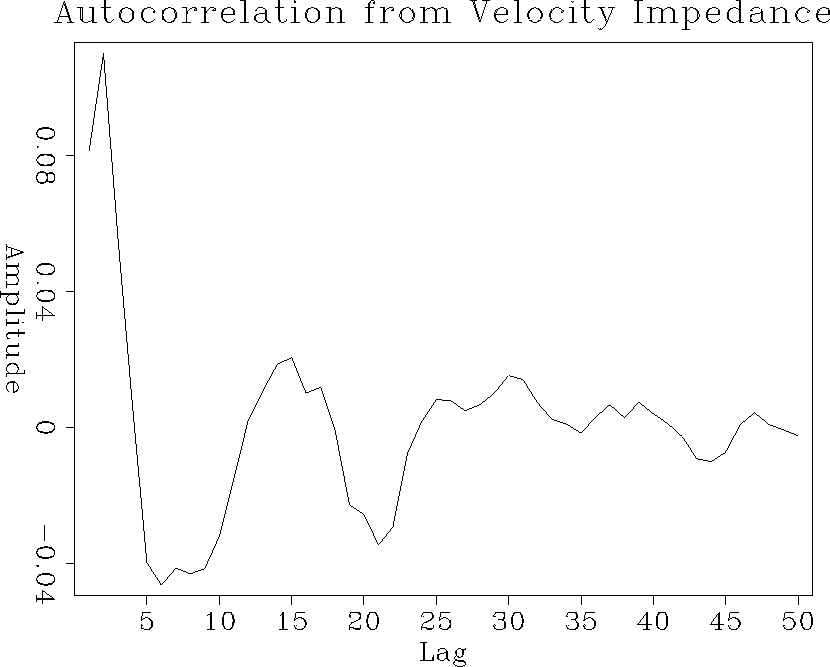
When looking over the numerous papers on transmission through thin layers (),(),(),(), we noticed that almost all the autocorrelations of real logs had a negative value at the first lag. On the other hand, the log we worked on did not have a negative value until the fifth lag. At first we thought that we might be dealing with a log in an area that had predominantly transitional deposition. This hypothesis seemed to be disproven when we looked at the impedance log corresponding to the autocorrelation function (see figure impedance512). The impedance function did not appear to have a significant low-frequency component that would correspond to transitional layering. A second hypothesis is that we are dealing with an area whose primary depositional pattern is cyclical, but the break between its transitional and cyclical component occurs at a higher thickness than we normally see (4ft to 1ft). This might be caused by a higher than normal rate of deposition (such as a time period in which flooding occurred much more frequently). Or possibly by a period in which the climate and sea level remained relatively constant causing the rate of facies change to decrease. A further possibility can be seen by comparing the density and the velocity logs. Namely, the density and the velocity logs did not appear to be perfectly aligned. This misalignment could explain some of the unusual behavior of our autocorrelation function. Figure auto2 shows the autocorrelation function assuming constant densiy; we notice that the autocorrelation has a higher frequency content and a negative value is obtained at the third lag.
 |
CONCLUSIONS
The loss of amplitude associated with transmission through a set of layers is directly related to stratigraphy. Cyclic sequences result in large transmission losses caused by the effects of very-short-delay multiple reflections. The transmission response of a set of thin layers is calculated using a two-term far-field solution. The method relies on a modification to the O'Doherty & Anstey solution to the transmissivity through a layered medium. Results from a test on a real log showed that the two-term approximation provides a very close approximation to the ODA solution. The advantage of this approximation is that it can provide connections with equivalent medium theory.
ACKNOWLEDGEMENTS
We would like to thank Mark Van Shaack for providing us with the well log data made available to the Stanford Tomography Project by Amoco company. [SEP,Rock]
![[*]](http://sepwww.stanford.edu/latex2html/prev_gr.gif)