 |
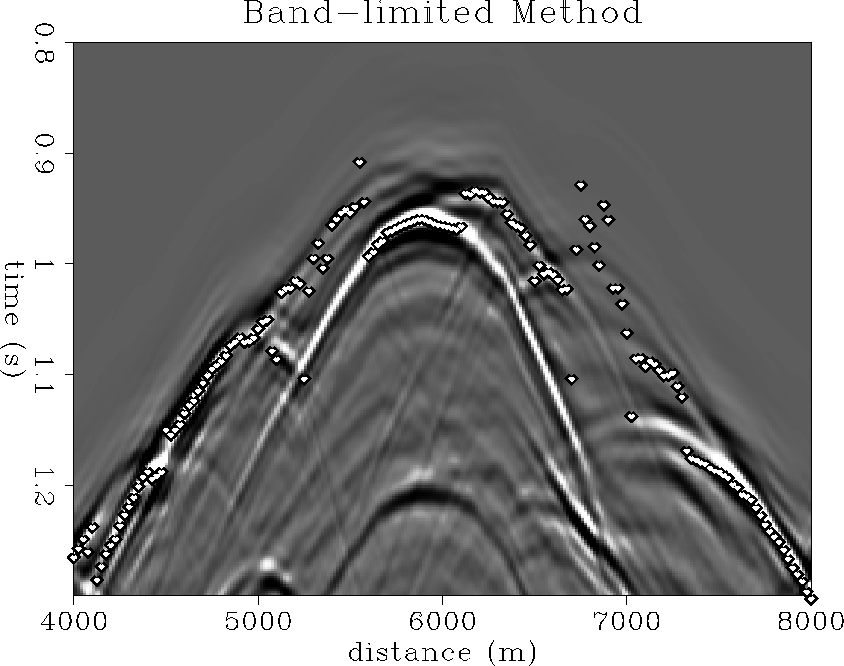
Figure 1 Band-limited Green's functions. Traveltimes are those for maximum energy arrivals, estimated from 16 frequencies in the range 10-60 Hz.
![[*]](http://sepwww.stanford.edu/latex2html/prev_gr.gif)
ABSTRACTWe compare several migration traveltime computation methods in the complex Marmousi velocity model. The methods considered include: Band-limited Green's functions, paraxial ray tracing, ``NORSAR'' wavefront construction, Zhang's local ray tracing, van Trier - Symes' upwind finite-difference scheme, and Podvin's eikonal solver. Each of the methods was tested by overlaying traveltime arrivals on a finite-difference wave-equation shot gather from a source buried in depth at the target zone. Based on these results, a few methods were selected for a full Kirchhoff prestack depth migration test on the Marmousi dataset. We find that if reasonable estimates of the most energetic arrival traveltime and phase are used, Kirchhoff migration can provide images of the Marmousi model that are of similar quality to finite-difference migration images. |
The Marmousi model is a realistic example of complex subsurface structure based on the geology offshore Angola. It has become a popular benchmark for seismic migration algorithms (Versteeg and Grau, 1990). We compare a range of traveltime computation methods on the Marmousi model in terms of (1) modeling accurate event arrival times and (2) facilitating a coherent prestack depth-migration image. We review the basic elements of each traveltime computation method in a companion paper in this report (Audebert et al., 1994).
Many groups have reported that Kirchhoff migration using ray-theoretic traveltimes is unsuccessful in imaging the complex areas of the Marmousi model, even when the exact velocity field is used, e.g., Geoltrain and Brac (1993). There are two main reasons proposed to explain the poor quality of these Kirchhoff images. The first explanation is that first arrivals may not be energetic. Ideally, the Kirchhoff algorithm should integrate over all (x,t) arrivals from each (x,z) location. However, if the migration integrates along only one arrival, and that arrival is weak in energy, the resulting migrated image is unlikely to be coherent. The second explanation is due to velocity smoothing. In order to ensure numerical stability of ray tracing and finite-difference eikonal solvers, the velocity field is often smoothed to meet some high-frequency ray validity conditions. Wave propagation in the smoothed velocity field may not be a good approximation to wave propagation in the un-smoothed velocity field, if the smoothing is excessive it can result in a distorted image, as shown by Versteeg (1993).
We test several aspects of Kirchhoff migration traveltimes, including first-arrival versus energetic-arrival traveltimes, phase-modified traveltimes and band-limited traveltimes. Our first test is an overlay of each method's traveltime arrivals on a finite-difference wave-equation shot gather from a source buried in depth at the target zone. Based on these results, a few representative methods are selected for a full Kirchhoff prestack depth migration test on the Marmousi dataset.
The methods tested
The methods we have tested, are mainly chosen because they are currently implemented at SEP. However we also have, with this spectrum varying from finite differencing the eikonal to band-limited Green's functions, covered the range of available alternatives for Green's function computations. The methods selected are: (1) Nichols' band-limited Green's functions, (2) Rekdal's implementation of paraxial ray tracing, (3) The NORSAR method with frequency dependent smoothing on the fly, (4) van Trier-Symes' finite differencing the eikonal, (5) Zhang's local ray tracing and (6) Podvin's first arrival traveltime method.
THE COMPARISON OF RECORDED TRAVELTIMES
We first compared the traveltimes computed by the different methods, for a point at 2500 m in depth and 6000 m from the left edge of the model, which is within the target (``reservoir'') zone. For comparison, we also computed the wavefield with a two-way finite difference modeling. The traveltimes are superimposed on this recorded wavefield, and are plotted as white-filled open circles (like frog eggs). In some of the methods the traveltimes are computed by having the source at the depth location and recording the traveltimes at the surface. In other methods, the traveltimes were computed by having sources at the surface. The different methods also have different representations of the velocity field. For some of the methods, the traveltime field was smoothed. Hence, the test is more an indication than an accurate comparison. The method implementations are briefly described in the following sections.
Band-limited Green's functions
This method estimates traveltime, amplitude and phase as a parametric fit to the outgoing Green's functions for a few frequencies. The outgoing wavefield is calculated using an implicit finite-difference scheme in polar coordinates. For this test, sixteen frequencies in the range 10-60Hz. were used. Figure bandlim-tt shows the traveltime values for one depth point superimposed on a full wavefield model with the source at that point. Since the events may have non-zero phase the traveltimes overlayed on the modeled data should be taken with a pinch of salt, adjacent points may not have the same phase.
The Green's functions were calculated for every surface location and then resorted to extract the traveltimes for the given depth point.
On the whole this method does a good job of picking out the maximum energy arrival at each location. In a few places it chooses an event that is apparently weaker than another. This may be due to the use of a one-way wave equation in the traveltime estimation and a two-way wave equation in the modeling code.
 |
Paraxial ray tracing Green's functions
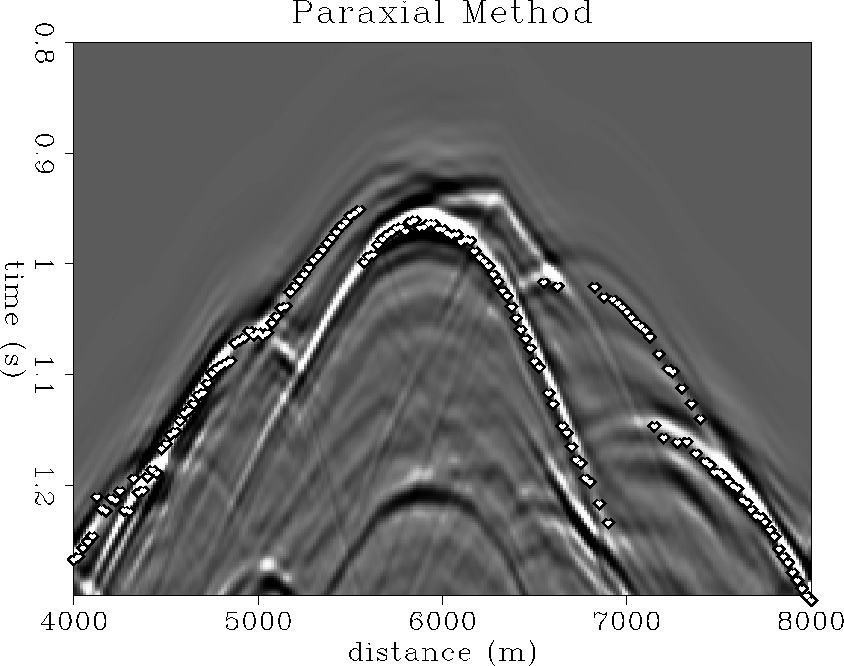
The Green's functions are computed in the smoothed Marmousi model. The model was smoothed with a Gaussian bell operator, with a half-width equal to the wavelength at a frequency of 30Hz. If multiple rays give an estimate at the same location the most energetic arrival is chosen. If two arrivals interfere at the time of the most energetic, they are merged into one arrival. Amplitude, phase and traveltimes are computed. The grid size was 8 by 8 meter for the velocity model, which was represented with bicubic splines. A Runge Kutta solver was used to compute the dynamic and kinematic ray equations.
The method seems to do a good job in picking the most energetic arrivals. The technique of merging two arrivals removes most of the high frequency noise which was caused by switching between closely spaced arrivals..
 |
NORSAR method
The NORSAR method that we used for these tests is a version implemented at SEP. Just as in the original NORSAR method, our version can compute first-arrival and later-arrival traveltimes. Due to memory and computer time constraints, we only tested NORSAR first arrival traveltimes.
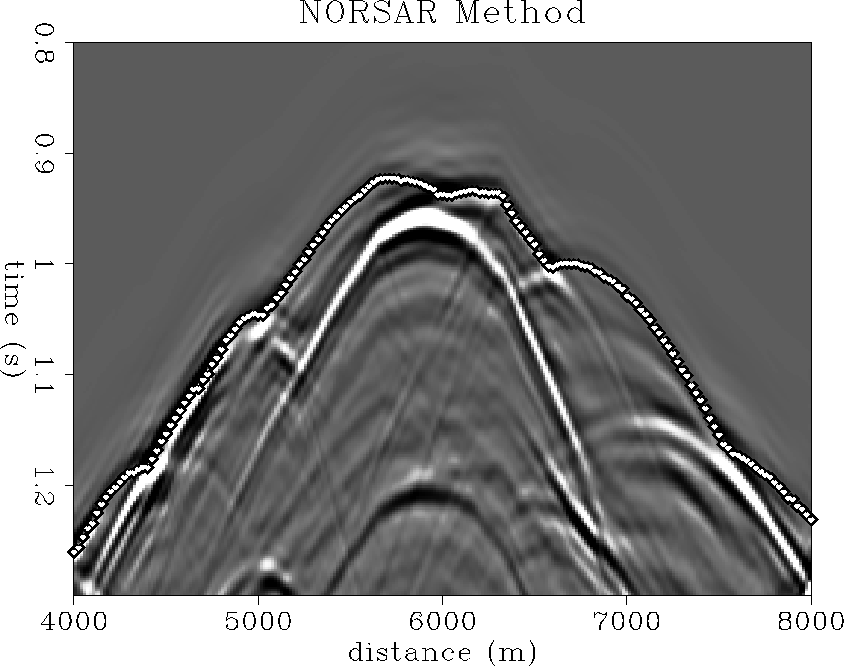
To trace the rays from wavefront to wavefront in the NORSAR method, we used Lomax's local wavelength-dependent velocity smoothing at an 80 Hz frequency. Other frequencies were also used, down to 10 Hz, but all produced (to eye precision) equal first-arrival traveltimes, suggesting a non-dispersive nature of the Marmousi model for first arrivals.
NORSAR traveltimes were computed on top of a 25 x 12.5 meters
mesh. A new ray is interpolated using a third order polynomial, every
time the the distance between 2 rays grows bigger than 21 meters, and
rays are eliminated from a wavefront, if they have crossed just before it. Figure
![[*]](http://sepwww.stanford.edu/latex2html/cross_ref_motif.gif) shows an overlay of NORSAR first-arrival
traveltimes upon the finite-difference modeled wavefield.
shows an overlay of NORSAR first-arrival
traveltimes upon the finite-difference modeled wavefield.
 |
Van Trier and Symes' method
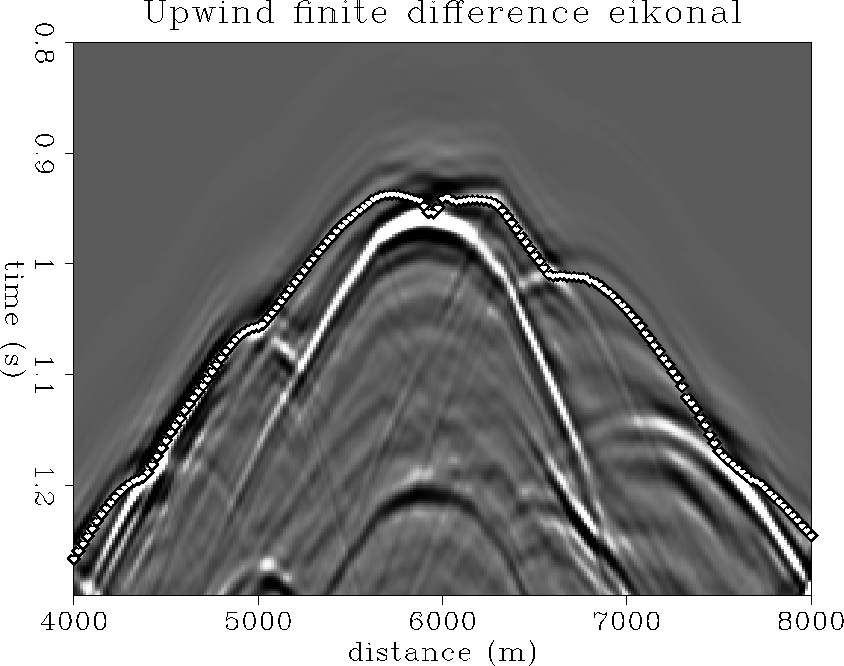
The upwind finite-differences solution of the eikonal proposed by van Trier and Symes(1990) solves a conservation law derived from the eikonal equation on a source-centered polar coordinate grid. The exact velocity was used and interpolated to the polar-coordinate grid. The radial step is adaptively modified in order to meet the stability conditions. This increases the cost considerably: in the Marmousi model it is about ten times the cost of a constant velocity model. After calculation in polar coordinates the first-arrival traveltimes are re-interpolated to cartesian coordinates.
Figure ![[*]](http://sepwww.stanford.edu/latex2html/cross_ref_motif.gif) shows the simulated traveltime that would have
been recorded at the surface, for a source located at the target.
Actually, the reciprocal first-arrival traveltime have been
used: the sources were put at the surface, and the traveltime was
recorded at the target point. According to reciprocity, the simulation should
be kinematically identical to the experiment with the source at the target.
shows the simulated traveltime that would have
been recorded at the surface, for a source located at the target.
Actually, the reciprocal first-arrival traveltime have been
used: the sources were put at the surface, and the traveltime was
recorded at the target point. According to reciprocity, the simulation should
be kinematically identical to the experiment with the source at the target.
When compared with the first arrival computed by Podvin's method, Fig
![[*]](http://sepwww.stanford.edu/latex2html/cross_ref_motif.gif) , and the NORSAR method, Fig
, and the NORSAR method, Fig ![[*]](http://sepwww.stanford.edu/latex2html/cross_ref_motif.gif) , this
method's first arrivals exhibit a slight bias, a small delay. Since
Podvin and NORSAR methods deliver almost perfectly identical first
arrival traveltimes, the velocity model discretization cannot be blamed. This
bias appears to be systematic in the van Trier-Symes method. It might
be related to the ``viscous'' approximation of the eikonal equation.
, this
method's first arrivals exhibit a slight bias, a small delay. Since
Podvin and NORSAR methods deliver almost perfectly identical first
arrival traveltimes, the velocity model discretization cannot be blamed. This
bias appears to be systematic in the van Trier-Symes method. It might
be related to the ``viscous'' approximation of the eikonal equation.
 |
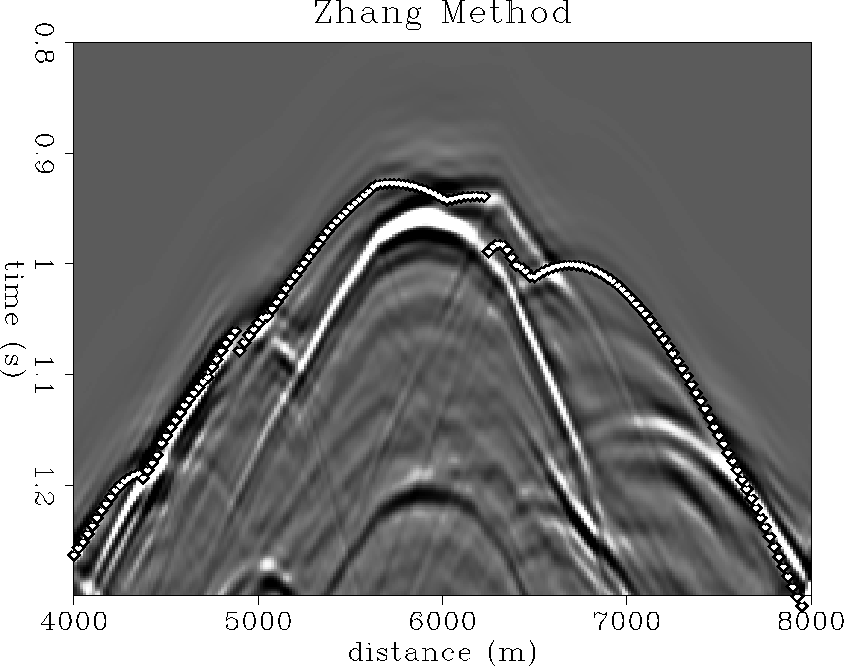
Zhang's local ray tracing method Zhang's method propagates wavefronts and their attributes by local ray tracing. Both first-arrival and energetic-arrival traveltimes may be computed, in addition to geometric spreading amplitudes and local wavefront angles. We test the energetic arrival times of Zhang's local ray tracing method, which are selected and propagated based on a local, rather than global, wavefront energy estimate. The process of local ray tracing inherently requires that any wavefront selection criterion be local; global wavefront attributes are not directly calculable. Unfortunately, the local energy selection criterion does not guarantee that Zhang's energetic arrival times will correspond to the ``most energetic'' arrivals in any global sense.
To compute Zhang's traveltimes, the Marmousi model was splined and regridded to a 6.25 by 6.25 m mesh. Energetic traveltimes were computed from a source location near the reservoir at depth up toward the receiver surface, and not in the reciprocal direction.
Figure ![[*]](http://sepwww.stanford.edu/latex2html/cross_ref_motif.gif) shows an overlay of the
Zhang energetic traveltimes on the finite-difference
shot gather. The Zhang traveltimes intercept
more wavefront energy in a few places compared to the
Podvin first arrival traveltimes of Figure
shows an overlay of the
Zhang energetic traveltimes on the finite-difference
shot gather. The Zhang traveltimes intercept
more wavefront energy in a few places compared to the
Podvin first arrival traveltimes of Figure ![[*]](http://sepwww.stanford.edu/latex2html/cross_ref_motif.gif) ,
especially where the first arrival energy is particularly weak. However,
the locally-energetic Zhang migration trajectory seems to miss most of
the significant globally-energetic shot arrivals needed to form a coherent
Kirchhoff image of the Marmousi reservoir.
,
especially where the first arrival energy is particularly weak. However,
the locally-energetic Zhang migration trajectory seems to miss most of
the significant globally-energetic shot arrivals needed to form a coherent
Kirchhoff image of the Marmousi reservoir.
 |
Podvin's method
Podvin's method computes first-arrival traveltimes at the nodes of a
rectangular grid, which defines constant slowness cells. The
traveltimes are initialized to zero at the source and infinity
elsewhere, they are then updated along a computation front. The
incremental traveltime between surrounding edges, faces or nodes, and
a target node, are computed using Huyghens' principle. All nodes,
edges, and faces on the previously updated computation front become
point sources or plane wave sources with respect to the nodes on the
next computation front. Fermat's principle is invoked to keep only
absolute minimum traveltimes. More recent implementations allow the
tracking of multiple branching and multiple arrivals. No amplitude
information is directly available. We ran the standard (first
arrival only) implementation in the Marmousi velocity model. The
original ![]() m velocity model was resampled to a
m velocity model was resampled to a ![]() m rectangular grid. In the first ``traveltime at the surface''
experiment, the source was actually put at the reservoir level, at
the target location. For the second experiment, migration, the
sources were put at the surface as in a real seismic experiment.
m rectangular grid. In the first ``traveltime at the surface''
experiment, the source was actually put at the reservoir level, at
the target location. For the second experiment, migration, the
sources were put at the surface as in a real seismic experiment.
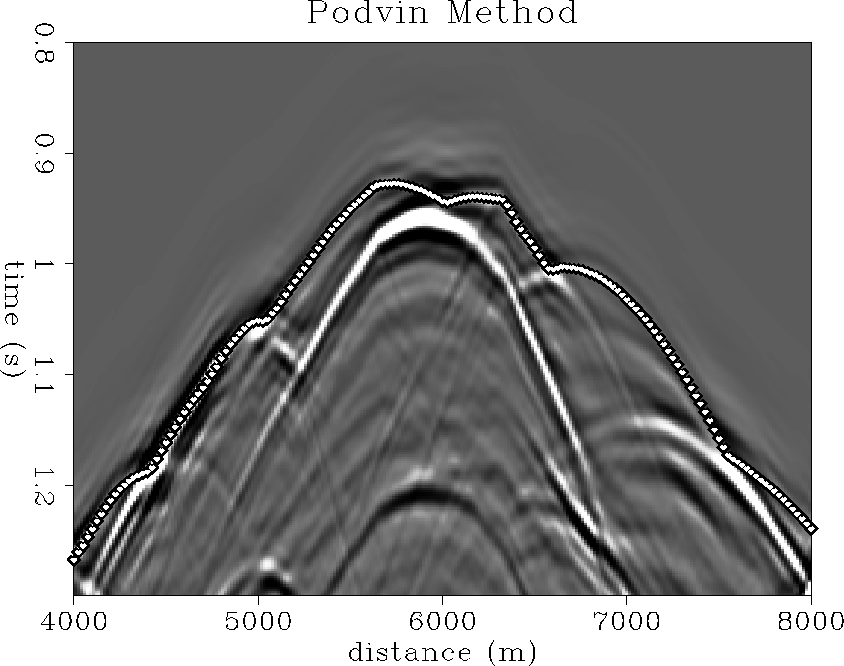
Figure podvin-tt displays Podvin's first-arrival traveltime at the surface, overlain upon the bandlimited modeled wavefield. We can observe that Podvin's program fulfills its duty of tracking first arrival traveltime perfectly.
 |
Comments on the traveltime estimates
The first arrival methods fulfill their duty. They duly find the exact first arrival, even when it is hardly visible. It is interesting to point out that first arrival traveltimes computed by van Trier's, Podvin's and ``NORSAR'' methods, Figures vantrier-tt, podvin-tt and norsar-tt, hardly differ, in this case, in spite of very different implementations (polar coordinates versus rectangular grid,etc.) or velocity model descriptions (smoothing, sampling, etc). The good news here is that all methods computing first arrival traveltimes give very consistent results, apparently depending very little on the velocity model parameterization.
As is already known, the corresponding first arrivals sometimes have little energy and are thus useless for imaging purposes. First arrivals are not necessarily the most significant arrivals, and particularly in Figures podvin-tt or norsar-tt, a summation along the first arrival curve would miss most of the energy. In the matter of tracking the most energetic or at least one energetic arrival, both ray tracing tuned for multiple arrivals, Figure paraxial-tt, and the band-limited method, Figure bandlim-tt, have some success. A simple kinematic summation along their (non-continuous) most energetic arrival curves will certainly capture a great deal of the energy in the wavefield, far more anyway than in the first arrival case. Nevertheless, one can notice that the amplitude and phase of the wavelet vary significantly along those paths. This suggests that a simple kinematic summation might fail to produce an optimally coherent sum. In order to avoid undesirable destructive interference, it seems important to take into account amplitude and phase variations along the summation path. This point is further developed in the following sections.
MIGRATING WITH THE COMPUTED TRAVELTIMES
The purely kinematic test
In a second comparative test, a pre-stack Kirchhoff depth migrated image of the Marmousi dataset was produced for each selected method. The algorithm used is a 2-D pre-stack algorithm that can take into account one traveltime, one amplitude and one phase value per depth point. Since only a few of the methods we tested can produce amplitude or phase information, we did a first comparison with traveltime only (i.e. amplitude set to unity). As in the former test, the exact velocity model was used, customized to meet the requirements of each traveltime method. Thus the migrated section is supposed to be optimal with respect to the given method. The comparison is expected to be objective and straightforward. Nevertheless, it has to be pointed out that this exact velocity model is essentially of academic interest, useful only for our comparisons. In real life, we would have to deal with approximate (or even plain wrong) velocity models, never as complex as this ``exact'' velocity model. An experiment closer to reality should use a blocky or strongly smoothed approximation of the Marmousi model; the comparison might yield slightly different conclusions. But this is another study in itself.
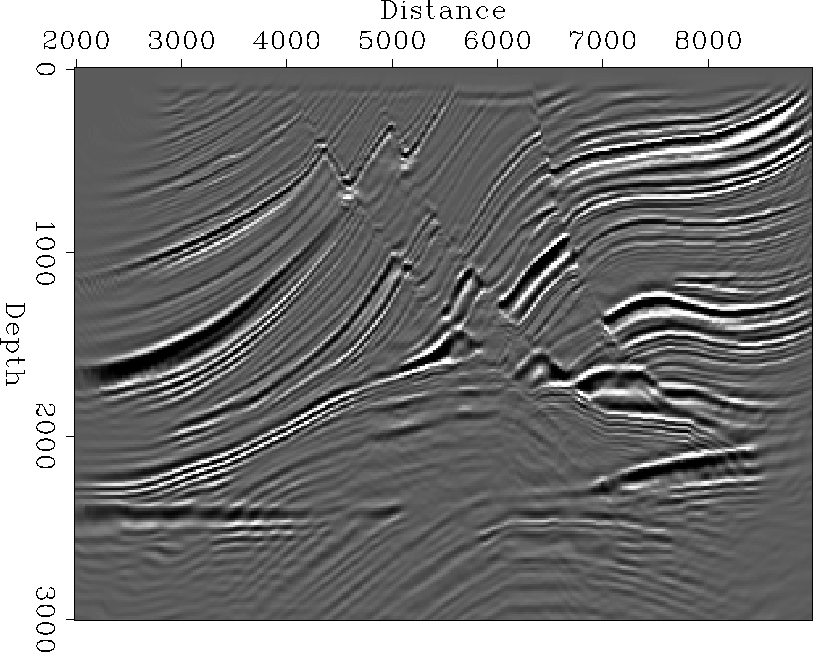
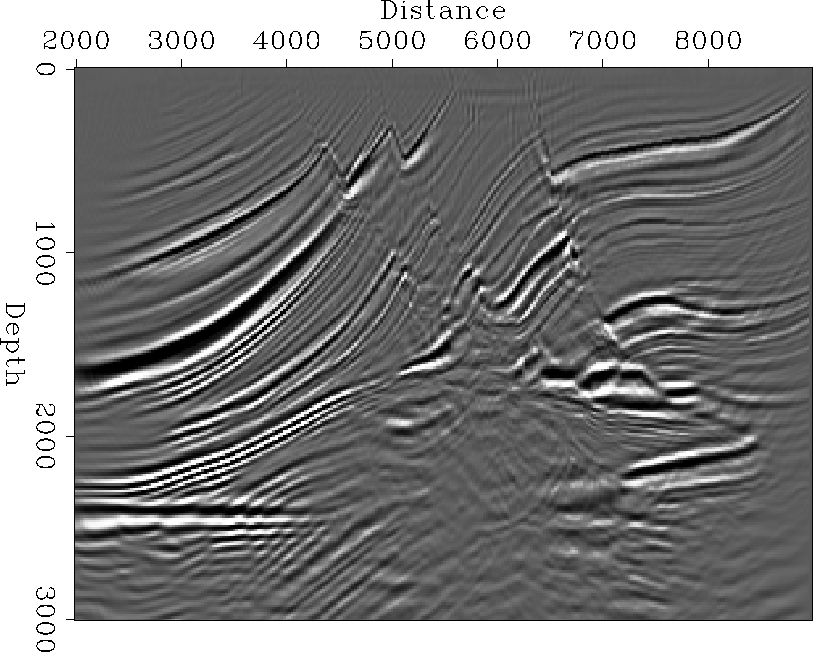
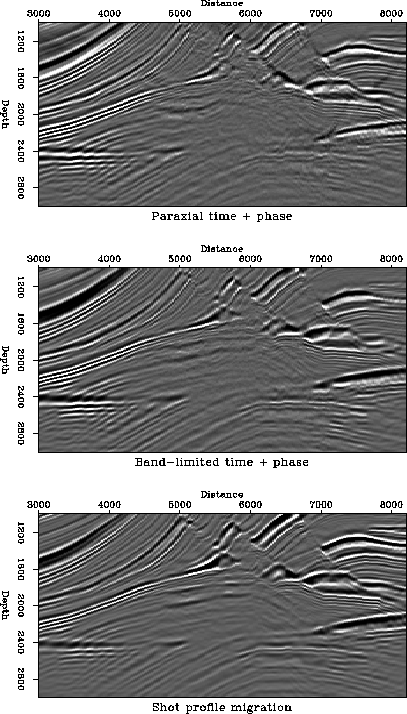
The migrated sections shown in the next few pages should be compared with a reference image, Figure shot-prof-stack3, the result of a finite-difference shot-profile migration.
 |
Migrating with first arrival traveltime
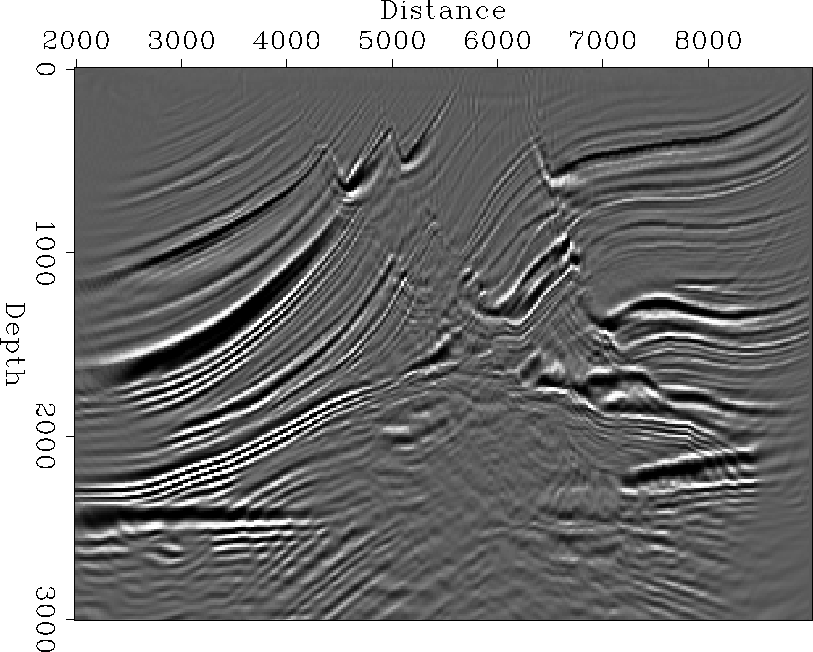
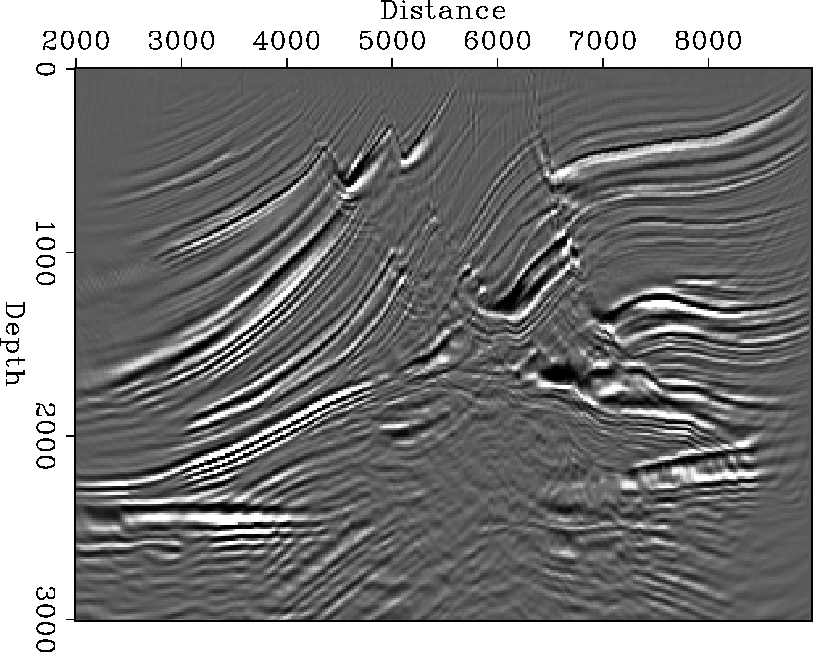
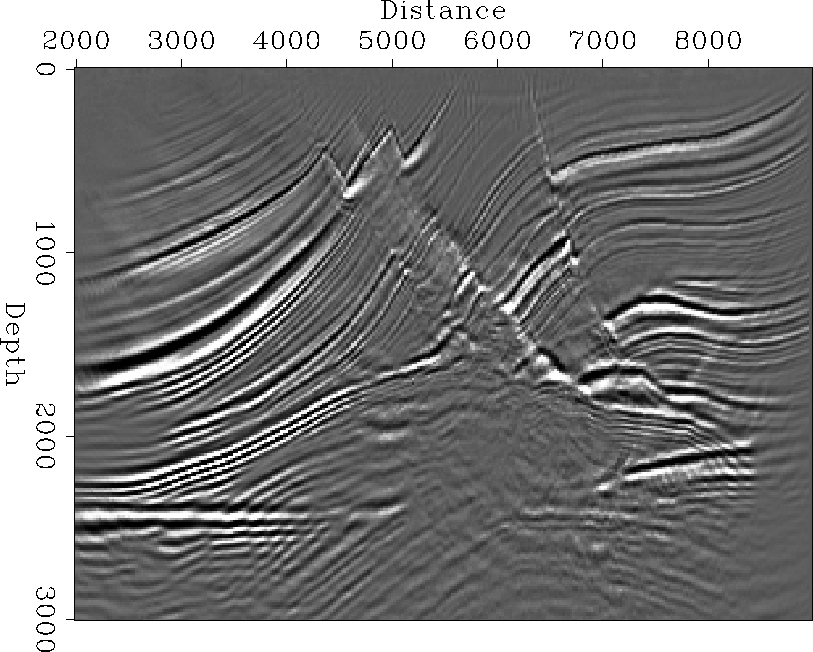
As expected, and as has already been mentioned by Geoltrain and Brac (1993), a kinematic migration with first-arrival traveltimes does an acceptable job in the outer, simple, part of the model, but a very poor one in the central complex area: Figures norsar-stack4, vantrier-stack4 and podvin-stack4. In other words, first-arrival traveltimes are useful for imaging as long as first arrivals are energetic arrivals. Unfortunately this condition may only be satisfied in simplistic, uninteresting cases.
One can observe that, though the traveltimes produced by the NORSAR method, see Figure norsar-tt, and Podvin's method, Figure podvin-tt appeared nearly identical, the migrated sections still have slight differences: Figures norsar-stack4 and podvin-stack4. The slightly different first-arrival traveltimes from van Trier's method lead to a more perceptibly different image.
Migrating with most energetic arrival traveltime
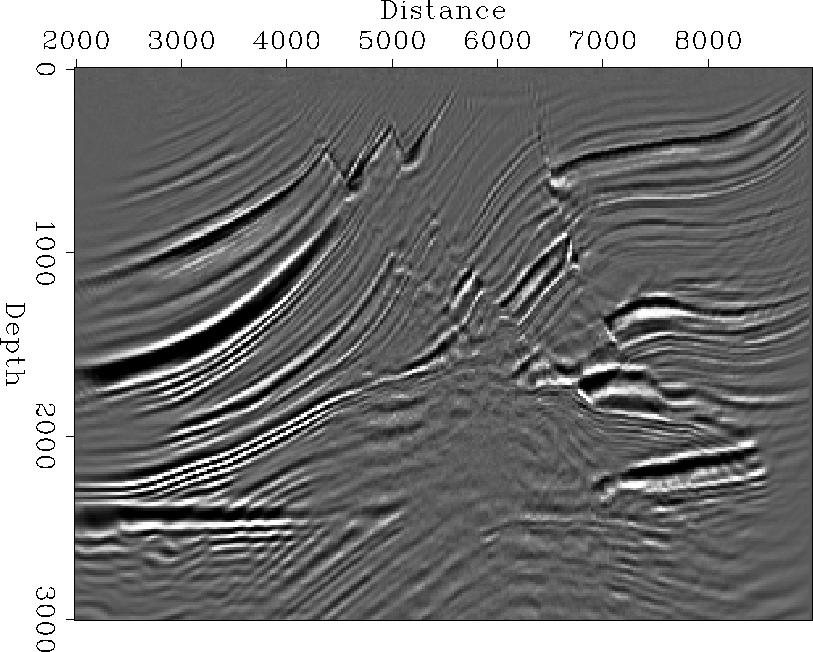
The novelty in the next two methods is that the ability to specifically choose the most energetic arrival (be it first, second or later arrival) brings significant improvement, even with a purely kinematic migration, i.e. without amplitude or phase weighting. The two methods having this ability, paraxial ray tracing, Figure paraxial-stack4, and the band-limited method, Figure bandlim-stack4, produce a far better image in the central complex part of the model. This is an indication that kinematic migration should become satisfactory, provided we track energetic arrivals instead of first arrivals. However, the comparison with the reference finite-difference migration, Figure shot-prof-stack3 shows that this is not yet sufficient. Some improvements are needed before trying to compete with the full-wavefield methods.
 |
 |
 |
 |
 |
MIGRATING WITH MORE THAN JUST TRAVELTIMES
We took the migration test a little bit further. Given the ability of our Kirchhoff migration to use amplitude and phase information, in addition to traveltime, we tried two methods to their full potential. Both the band-limited method and paraxial ray tracing are able to produce amplitude and phase in addition to the traveltime of the most energetic arrivals. Using this complete set of attributes, we should get pretty close to the result of a full-wavefield migration method.
The pseudo-dynamic migration test
In the previous section, we saw, Figures paraxial-stack4 and bandlim-stack4, that tracking most energetic traveltime brought significant improvements, even with no proper amplitude factor. But there was still the problem of the irregular variations of amplitude, and of the phase rotation along the summation path: remember Figures bandlim-tt and paraxial-tt. The reason is that the later, more energetic, arrivals may pass through caustics, and each time experience an abrupt phase rotation. If these abrupt rotations of phase are not recognized and taken into account, the energy may fail to add constructively along the summation path. Finite-difference, full-wavefield methods do not experience this sort of problem, because they automatically calculate the correct amplitude and phase, as long as they are provided with a correct velocity model.
So, in order to compare Kirchhoff migration fairly, three-parameters
tables have to be supplied, traveltime, amplitude and phase.
Migrating with traveltime and phase
In order to assess the relative importance of these three
parameters, we first experimented with only two of them, traveltime
and phase. The phase is a wavelet phase rotation. The migration
operator takes into this account this phase by doing a cosine - sine
interpolation between the original input data and a copy that has had
![]() phase rotation applied.
phase rotation applied.
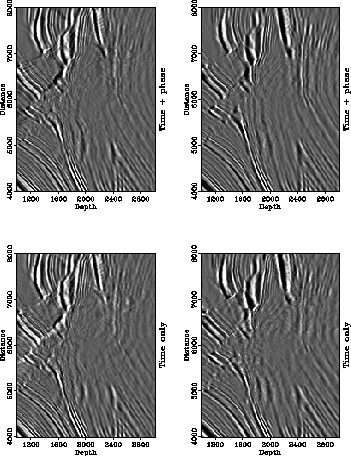
In Figure all-t-tp migration with traveltime and phase is compared to the migration with traveltime only, on a close-up of the target zone. The coherence and continuity of the reflectors is improved in both cases. The improvement is more noticeable in the image created using band-limited Green's functions.
The output of Kirchhoff migration with traveltime and phase should be comparable to the output of finite-difference migration. The imaging principle of the former, the stack of phase-corrected but unweighted raw data, is similar to the imaging principle of the latter, a phase-shift and cross-correlation applied to data which has been corrected for spherical divergence. Both methods produce structural images rather than true reflectivity estimates. Figure all-tp-sp compares the three methods on a close-up of the target area. The comparison is encouraging, the band-limited method in particular comes close to the reference finite-difference section.
Migrating with traveltime, phase and amplitude
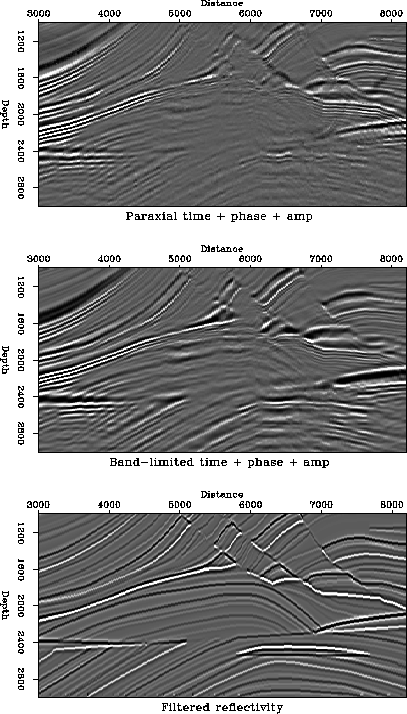
Now we use all three parameters in the imaging, Figure all-ref. This time, the images from paraxial ray tracing and the band-limited method are compared to a filtered version of the true reflectivity of the Marmousi model. The reason for this is that the Kirchhoff migration/inversion divides the Kirchhoff integral by the integral of the Green's function, and thus delivers a ``true'' reflectivity estimate. The results are quite encouraging, most of the artifacts of kinematic migration are gone. In particular, we do not see any of the over-migration patterns typical of first arrival traveltime, Figures vantrier-stack4 and podvin-stack4, nor the irregular amplitude along the reflectors which was still visible when using most-energetic traveltime, without amplitude or phase factors, Figures paraxial-stack4 and bandlim-stack4. The relative amplitudes of the events are closer to the true reflectivity than the full-wavefield migration results. In that respect the Kirchhoff migration result is superior to the finite difference migration.
 |
 |
 |
FIRST ARRIVAL OR MOST ENERGETIC ARRIVAL ?
Which is the best, first arrival or most energetic arrival ? The question is one of feasibility versus desirability.
Computing first arrival traveltimes is highly feasible. Many methods, some very fast, are able to produce first arrival traveltimes. Moreover, the traveltimes obtained seem pretty reliable; they do not seem to vary significantly with respect to the method chosen or the velocity model parameterization. One subject for further study is, to check whether first arrival traveltimes change with the smoothing of the velocities. Intuition would say that first arrival traveltimes would vary (decrease) with increased smoothing of the velocities, while our initial experiments would suggest that such variation is very weak. Without the benefit of further studies, let us then assume that the computation of first arrivals is fast, reliable and robust. First arrival traveltimes also exhibit another nice property, first arrival curves, or maps, are strictly continuous and piecewise differentiable, Figures norsar-tt and podvin-tt. Even though it would have been even more useful if they were continuously differentiable, these properties mean that first arrival traveltimes can reasonably, if not precisely, be interpolated, or decimated and re-interpolated. In a practical world where decimation and paucity are sweet words, this property is very important. Finally, though it has not been mentioned in the present study, one might wonder whether applying correct amplitude weights to first arrivals (for instance zero when they are insignificant) would not reduce some of the drawbacks of migration with first arrivals. After all first arrivals are still real arrivals.
Most-energetic traveltimes are desirable. We have shown that they allow us to bring kinematic migration close to the quality of the expensive full-wavefield migration. One problem, is the extra cost of computing and selecting one or several most energetic arrivals. Only a few methods are able to find most energetic arrivals: band-limited Green's functions, ray methods, Figures bandlim-tt and paraxial-tt, and to some limited extent, Zhang's local ray tracing, Figure zhang-tt. Not all of them have low cost. A second problem is that only the band-limited method finds most energetic arrivals in a finite bandwidth sense. It is not clear whether the most energetic arrivals for infinite frequency (or infinite bandwidth) as computed by ray methods, necessarily correspond to energetic arrivals in a real band-limited world. A third problem is that a most energetic arrival traveltime curve (or map) has no guaranteed characteristics, it has at best some piecewise continuity, see Figures bandlim-tt and paraxial-tt again. This means that interpolation or re-interpolation are difficult, a definite drawback for 3-D applications.
According to the fathers of the Marmousi experience, the people at IFP, finite-difference migration does a far better job than (first arrival) kinematic Kirchhoff migration.
In this paper we show that if the Green's functions used for Kirchhoff migration are computed with an accurate and reliable method, Kirchhoff migration yields structural images that are very similar in quality to the results of finite-difference migration. In addition, Kirchhoff migration/inversion can produce reflectivity estimates that are a better match to the true reflectivity. From the perspective of 3-D prestack imaging this result is encouraging, since for many 3-D prestack datasets at the present there are no realistic alternatives to Kirchhoff methods.
The most important characteristic of a Green's function evaluation method is the ability to compute multiple arrivals and to select among them the most energetic ones. As a consequence of the need to select arrivals according to their energy, a reliable computation of relative amplitudes is also crucial. Finally, the use of the phase of the arrivals during the summation step, in addition to the traveltime and amplitudes, considerably improves migration results. Since the most energetic arrivals often correspond to the superposition of a few interfering arrivals, a reliable estimate of the phase depends on the application of an appropriate arrival-merging method.
We wish to thank IFP for creating the Marmousi dataset and making it available for everybody to use. The shot-profile migration was generated using the ProMAX processing system supplied by Advance Geophysical.
REFERENCES
![[*]](http://sepwww.stanford.edu/latex2html/prev_gr.gif)