![[*]](http://sepwww.stanford.edu/latex2html/prev_gr.gif)
In an earlier paper in this report Nichols describes a method for estimating traveltime, amplitude, and phase as a parametric fit to the solution of the Helmholtz equation at a few frequencies. In that paper the Helmholtz equation is solved in a 2-D polar coordinate frame. This has some advantages in the specification of the initial conditions and the extrapolation of the traveltime estimates. However, it required the development of a 2-D polar coordinate finite difference scheme to solve the Helmholtz equation.
The aim of this paper is to extend the scheme to 3-D. We could have developed an algorithm to solve the Helmholtz equation in 3-D polar coordinates, indeed this may be the most efficient scheme in the long term. Instead we have chosen to adapt an existing wavefield extrapolation scheme for use in the algorithm. The method we propose can be applied to any pre-existing frequency domain depth extrapolation scheme.
The extrapolation scheme we chose is the modified Hale-McClellan extrapolation scheme (). The wavefields are extrapolated in depth one frequency at a time via a two-dimensional convolution of the data with a circularly symmetric, frequency dependent, and velocity dependent filter.
Since this method is applied in a 3-D rectangular coordinate frame we had to adapt the band-limited Green's function method to work in this domain. The extra effort was small, there were two main changes from the polar coordinate code. First, the algorithm must calculate a region of validity for the wavefield. Second, the updating of the traveltime-estimation window must handle the expanding region of validity.
MODIFICATIONS FOR 3-D
Region of validity
The main problem associated with using 3-D rectangular coordinates is
that the depth extrapolation algorithm does not produce a valid
estimate of the wavefield on the whole grid. If the propagator has a
dip accuracy of ![]() , the valid region will be a cone with an
opening angle of
, the valid region will be a cone with an
opening angle of ![]() and its apex at the source location. In
this implementation we have chosen to approximate this cone with a
pyramid. The only reason for this is that a square cross section is
easier to deal with when creating subsets of fortran arrays.
and its apex at the source location. In
this implementation we have chosen to approximate this cone with a
pyramid. The only reason for this is that a square cross section is
easier to deal with when creating subsets of fortran arrays.
Expanding the traveltime-estimation window
In 2-D polar coordinates the estimation of the time window around the
correct alias of the wavefield is very simple. The traveltime at the
previous radius is shifted by ![]() , where
, where ![]() is the
increment in radius and v is the local velocity. This traveltime is
taken to be the center of the window in which a new maximum energy
event is picked. The same approach can be used when the
extrapolation is in depth, but there is a problem; the region of
validity expands as the wavefield is extrapolated downwards. This
means that for some locations there will be no valid traveltime
estimate at the previous depth level.
is the
increment in radius and v is the local velocity. This traveltime is
taken to be the center of the window in which a new maximum energy
event is picked. The same approach can be used when the
extrapolation is in depth, but there is a problem; the region of
validity expands as the wavefield is extrapolated downwards. This
means that for some locations there will be no valid traveltime
estimate at the previous depth level.
This situation is illustrated in Figure time-extrap. In the central square the traveltime can be extrapolated in depth from the previous level. In the shaded area the traveltime must be estimated from the traveltimes in the inner square. This is currently done in a very simple minded way, the traveltimes along each edge are simply copied outwards to fill the shaded region. The corner areas take the value at the corner of the inner square. This simple method works because these traveltimes do not have to be too accurate, they are only needed to define the search window. Once the search window has been defined the algorithm is exactly the same as that defined in the previous paper.
time-extrapheight=3.5in.Extrapolation of the traveltime window from one depth level to the next.
Depth extrapolator
We used a Hale-McClellan type explicit downward extrapolation routine to downward continue our wavefield. The main reason for choosing this routine is that we already had an efficient, working version. Also the operator, has very good numerical azimuthal isotropy. It handles a v(x,y,z) velocity model. In the examples shown we used a 17-point McClellan filter and an extrapolation filter table made up of filters with a half-length of 40 samples.
EXAMPLES
Constant velocity
The first test that a Green's function estimation method should pass is to produce the correct answer in a constant velocity model. Figure const-vert shows a contour plot of a vertical slice through the traveltime field for a constant velocity model. Figure const-horiz shows a horizontal slice through the traveltime field for the same model. The answer is only estimated within the central pyramid that defines the region of validity. Outside that region the traveltime is set to minus-one to indicate an invalid region. The projection of the pyramid is a triangle on the vertical slice and a square on the horizontal slice. The traveltimes are correct for a spherical outgoing wavefront in this medium (V=2000m/s). Figure const-amp graphs the amplitudes vertically below the source. It shows the 1/r amplitude decay expected in 3-D propagation.
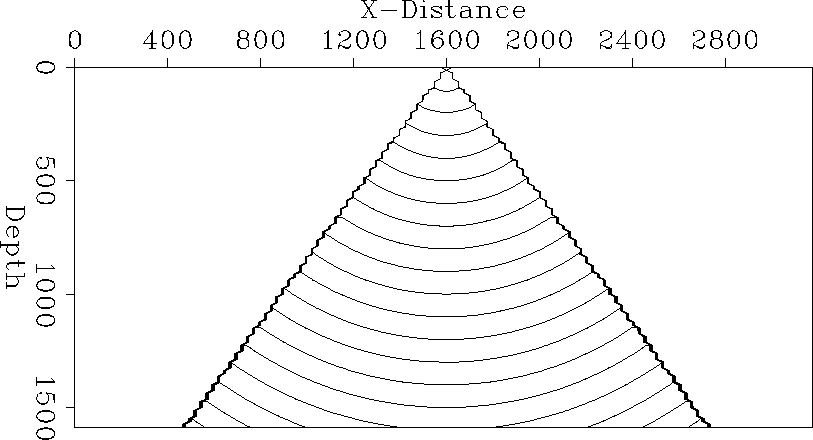 |
![[*]](http://sepwww.stanford.edu/latex2html/movie.gif)
|
const-horiz
Figure 2 Contour plot of a horizontal slice through the center of a 3-D traveltime field for a constant velocity model. | 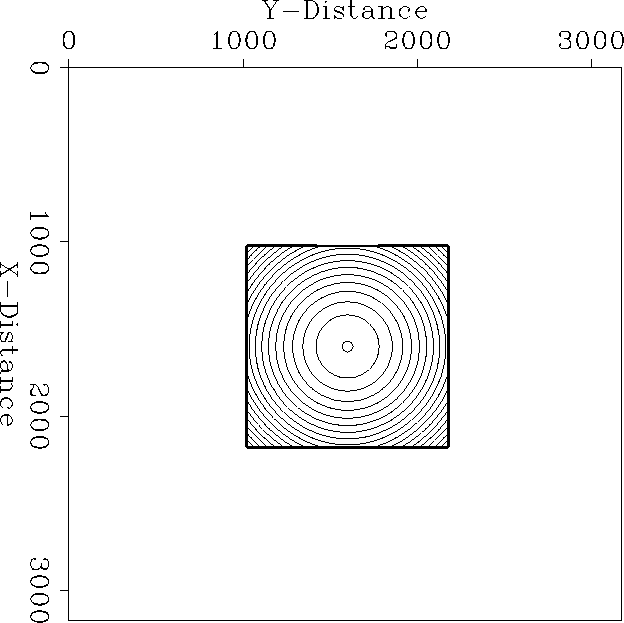 |
|
const-amp
Figure 3 Amplitude decay in a 3-D constant velocity model. | 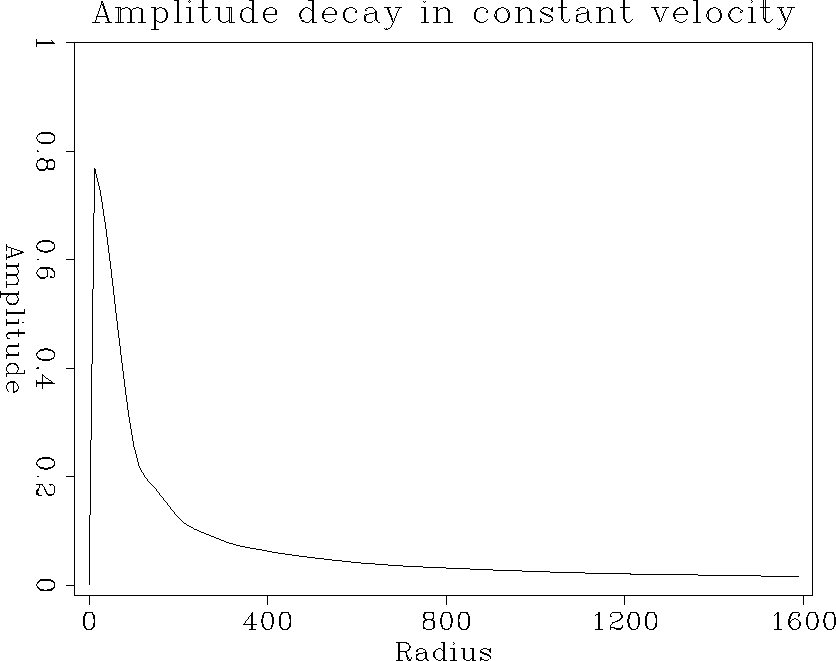 |
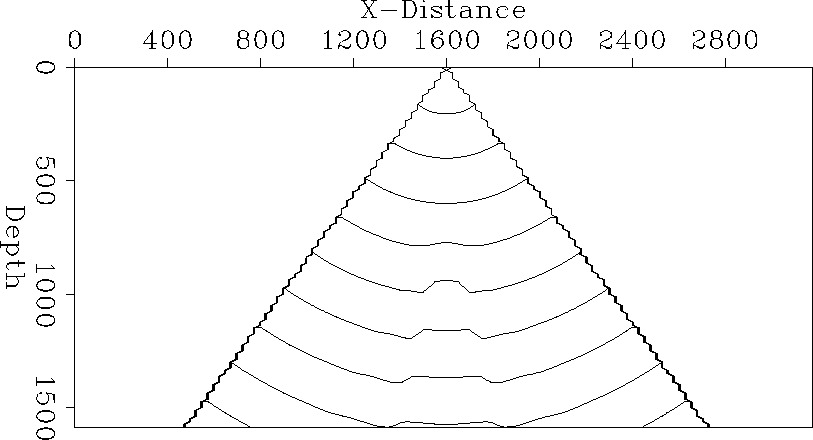
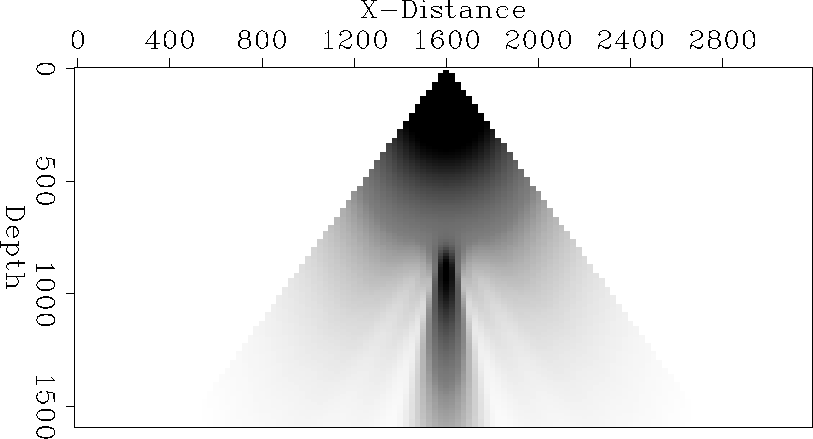
Spherical velocity anomaly Our first simple model in 3-D is a ``blob'' model. It has a spherically symmetric anomaly with a Gaussian radial profile. The anomaly lies in the center of the velocity model, directly below the source location. The background has a velocity of 4000m/s and the peak of the anomaly has a velocity of 3000m/s.
The traveltime field in the model is shown in Figure blob-vert. The delay of the wavefront through the anomaly and the later healing of the wavefront is clearly seen. The amplitude field shown in Figure blob-amp illustrates the focusing effect of the anomaly. There is a 3-D caustic below the blob.
 |
![[*]](http://sepwww.stanford.edu/latex2html/movie.gif)
 |
Cylindrical velocity anomaly
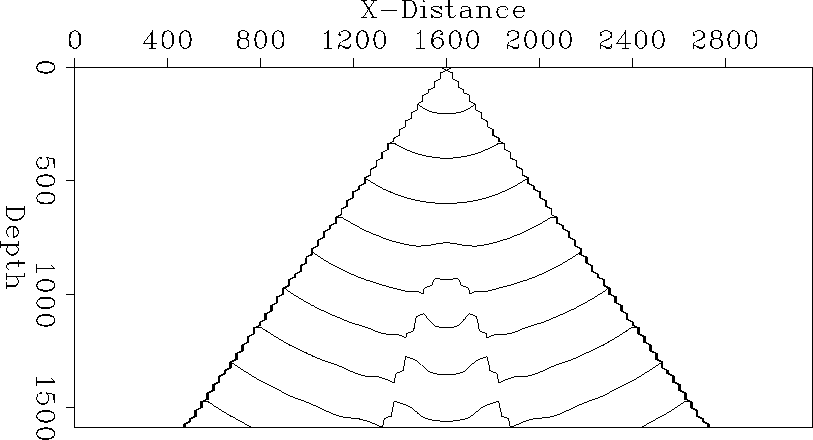
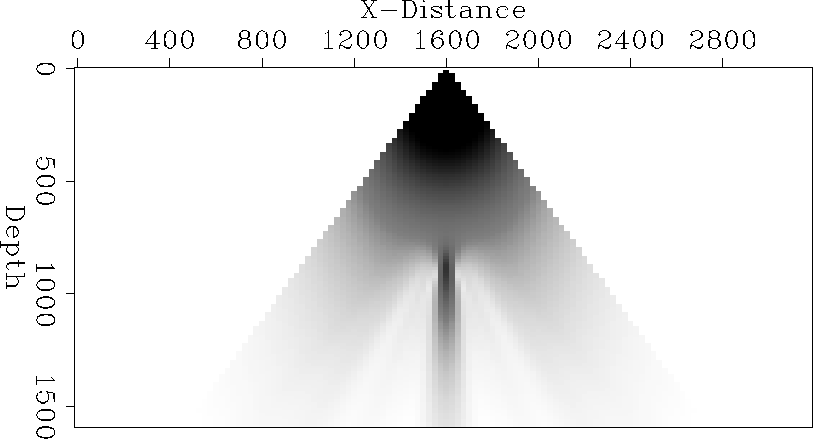
Figure cyl-vert shows the traveltime contours in a model which has a cylindrical Gaussian velocity anomaly rather than a spherical one. As we would expect, the traveltime field is quite different from the one in the spherical anomaly model. The wavefront does not ``heal over'' as it does in the other model. The amplitude field is shown in Figure cyl-amp, as expected the focusing effect is less than in the spherical model. The caustic in this medium is only a 2-D caustic.
These two results are the first results we have obtained with this method. We have not had time to check their accuracy but they display the gross features that we would expect.
 |
![[*]](http://sepwww.stanford.edu/latex2html/movie.gif)
 |
SUMMARY
We have taken an existing 3-D downward continuation code and turned it into a method for estimating traveltime, amplitude, and phase. Since only a few frequencies are extrapolated, the cost is much less than a full wavefield modeling algorithm.
The first results that we have obtained appear promising, but much work remains to be done in validating the method.
ACKNOWLEDGMENTS We would like to thank Biondo Biondi for providing the filter tables used in the extrapolation.
[SEP]
![[*]](http://sepwww.stanford.edu/latex2html/prev_gr.gif)