
![[*]](http://sepwww.stanford.edu/latex2html/prev_gr.gif)


Next: About this document ...
Up: Table of Contents
3-D seismic monitoring of an active steamflood
David E. Lumley
Author has no known email address
ABSTRACT
I present an idealized physical model of steamflood fluid-flow
and make rock physics predictions of seismic impedance changes that might
be observable in 3-D surface seismic monitoring data.
Four distinct fluid-flow phases are considered. Closest to the
steam injection well, a small hot steam zone should be very visible
in seismic data due to a predicted 30% decrease in P-wave velocity (Vp)
compared to
pre-steam reservoir conditions. With increasing radial distance from the
injector, an annulus of hot water is likely to be seismically transparent
due to a weak (5%) decrease in Vp, but a larger radial annulus of
hot oil may be visible due to a predicted 10-15% decrease in Vp.
A high-pressure cold oil front is predicted to propagate away from the
injector one order of magnitude faster than the thermal fronts.
If the increased pore pressure due to steam injection forces the
high-pressure cold oil to cross the bubble point, a large increase
in Vp of at least 15% may be visible in seismic monitor data.
This model is currently being tested on a 3-D field data set.
Preliminary results are exciting and will be published later this year.
|
INTRODUCTION
The steamflood process is a common method of
enhanced oil recovery in tertiary production. However, steam flow patterns
and sweep efficiency can be unpredictable in the presence of reservoir
heterogeneity. Recently, a few experiments have been conducted
that consist of shooting several 3-D surface seismic ``monitor''
surveys in time-lapse mode during steam injection (e.g.,
Pullin et al., 1987, and Eastwood et al., 1994). The spatial changes
in pressure, temperature and fluid saturation in the reservoir during
steamflooding can cause dramatic changes in rock physics properties
and seismic wavefield attributes (e.g., Ito et al., 1979; Wang and Nur, 1988).
In principle, detecting and
measuring changes in seismic response as a function of time can lead to
a better understanding of the steamflood dynamics, and in turn,
an optimized strategy for enhanced oil recovery (Nur, 1989).
A first-order goal is to simply ``detect'' changes in the reservoir
due to steam injection. This may appear in the form of velocity
pull-down in seismic images associated with thermal effects,
and amplitude focusing or attenuation.
However, a more elusive goal is to use the seismic measurements to
make quantitative statements about the steamflood fluid-flow process.
Surface seismic monitoring could be extremely valuable in optimizing reservoir
development and production if it could ``resolve'' individual
steamflood fluid-phase fronts, and predict preferential directions
for future oil production flow. To achieve this goal,
I intend to integrate fundamental physics from fluid-flow simulation,
rock physics, and seismic modeling, imaging and inversion.
In particular, I hope to demonstrate that the seismic monitor surveys
contain enough information to distinguish the spatial advance of:
(1) a high-pressure, low-temperature heavy oil zone, (2) a high-pressure,
high-temperature heavy oil zone, (3) a high-pressure, high-temperature water
zone, and (4) a high-pressure, high-temperature desaturated steam zone.
This model is currently being tested on a 3-D field data set.
Preliminary results are exciting and will be published later this year.
AN IDEALIZED STEAMFLOOD MODEL
It is convenient to have an idealized model of the steamflood
fluid-flow physical properties in order to make some
predictions about the nature of rock physics and seismic responses
during steam injection. I consider four separate fluid zones
associated with the steamflood:
(1) a high-pressure, low-temperature heavy oil zone, (2) a high-pressure,
high-temperature heavy oil zone, (3) a high-pressure, high-temperature water
zone, and (4) a high-pressure, high-temperature desaturated steam zone.
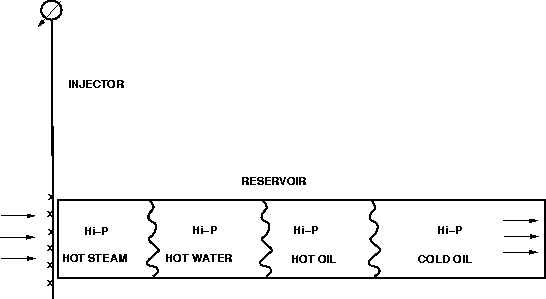
This simple model is schematically diagrammed in Figure ![[*]](http://sepwww.stanford.edu/latex2html/cross_ref_motif.gif) .
This model is slightly more complicated than the conventional block
model of a heated zone and a cold zone, but does not try to incorporate
the complexity of mixed fluid phases, emulsions, fingering, gravity
overrides, etc., as described by Lake (1989) for example.
.
This model is slightly more complicated than the conventional block
model of a heated zone and a cold zone, but does not try to incorporate
the complexity of mixed fluid phases, emulsions, fingering, gravity
overrides, etc., as described by Lake (1989) for example.
This model is qualitatively supported by a common observation:
pressure fronts travel faster than thermal fronts.
In well-to-well pressure transient tests, it takes on the order of
hours to days for a pressure pulse at one well to propagate to
an adjacent well. Pressure is transmitted through the fluid
in the connected pore space at a relatively fast rate because it
does not require fluid transport or conduction to diffusively propagate.
On the other hand, temperature monitoring wells show that thermal
fronts take on the order of weeks to months to propagate similar
well-to-well distances. This is because heat transfer must occur through
a combination of conduction through the rock matrix and transport
of heated fluids through the permeable pore space, both of which
tend to be relatively slow processes.
Therefore, to first approximation, a steam-induced pressure front
will travel about one order of magnitude faster than the associated
thermal front. This implies that to a distant observer in the reservoir,
the first front to arrive will be a high-pressure cold oil front.
The next zone to arrive will be high-pressure heated oil as the
thermal effects propagate outward from the steam injector.
A hot water zone of condensed steam follows that heats the oil
ahead of it, lowering the oil viscosity enough to displace oil
with water as it propagates radially away from the injector.
Finally, closest to the injector, a hot steam zone with negligible
fluid saturation exists as the heat source that drives the total
fluid-flow process. It is likely that the steam zone would reach
steady-state equilibrium conditions fairly quickly and maintain a stable
but slowly expanding disk of growth. In contrast, the pressure front
is likely to be large and may propagate rapidly to remote sections of
the reservoir. The hot oil and water zones are probably intermediate
in size between the steam and high-pressure cold zones.
steam-fronts
Figure 1 An idealized model of steamflood
fluid flow. A rapid high-pressure cold front is expected
to lead the injector flow, trailed by hot oil, hot water
and hot steam zones. The relative dimensions of each zone
may not be to scale, and complexities such as mixed phases
and gravity overrides are neglected.
ROCK PHYSICS PREDICTIONS
Based on the simple steamflood model of Figure ![[*]](http://sepwww.stanford.edu/latex2html/cross_ref_motif.gif) ,
some rock physics analysis can be made to give approximate
estimates of seismic impedance changes that may occur in the reservoir
during the steamflood. These rock physics predictions give an indication
as to what might be observed in time-lapse 3-D surface seismic monitor
surveys. The effects of pressure, temperature, gas/fluid saturation,
lithology, and hydrocarbon P-T phase diagrams are considered for
each of the four steamflood zones described above.
,
some rock physics analysis can be made to give approximate
estimates of seismic impedance changes that may occur in the reservoir
during the steamflood. These rock physics predictions give an indication
as to what might be observed in time-lapse 3-D surface seismic monitor
surveys. The effects of pressure, temperature, gas/fluid saturation,
lithology, and hydrocarbon P-T phase diagrams are considered for
each of the four steamflood zones described above.
Hi-pressure cold oil front
It has been experimentally observed that dry-rock measurements of
P-wave velocity (Vp) and S-wave velocity (Vs) vary with differential
pressure. Since the differential pressure Pd is equal to the
overburden confining pressure Pc less the pore pressure Pp,
and overburden pressure remains constant in a reservoir during
production time scales, Vp and Vs can be graphed from dry rock
measurements as a function of pore pressure.
Han (1986) made core measurements
on unconsolidated Ottawa sand (porosity 33%) that is structurally similar
to many shallow reservoir rocks that are subject to cyclic steam
soaking and steam injection drive.
Han measured dry Vp and Vs as a function
of confining hydrostatic stress, which can be converted into
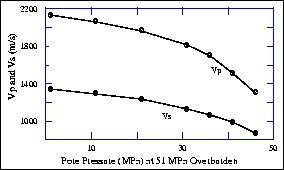
velocity as a function of pore pressure, as shown in Figure ![[*]](http://sepwww.stanford.edu/latex2html/cross_ref_motif.gif) .
.
In many sedimentary basins, the overburden pressure
increases approximately linearly with depth at 1 psi/ft.
For a shallow reservoir at 200 m depth, the overburden pressure would
be about 4.5 MPa (670 psi).
After some time of primary and secondary production, the reservoir
may have a pore pressure as low as 0.7 MPa (100 psi).
During steam injection, the pore pressure at the injector may be as
high as 2.4 MPa (350 psi), and would decay logarithmically with radial distance
from the injector. This pore pressure increase of a few MPa due to
steam injection decreases the P-wave velocity by only a few percent,
as suggested by Figure ![[*]](http://sepwww.stanford.edu/latex2html/cross_ref_motif.gif) . The decrease may be slightly
slightly more than Figure
. The decrease may be slightly
slightly more than Figure ![[*]](http://sepwww.stanford.edu/latex2html/cross_ref_motif.gif) suggests, because a
shallow steamflood reservoir has an overburden pressure of about
5 MPa, whereas Han's data are more suited to a reservoir
at 2 km depth and 51 MPa overburden pressure. In summary,
the steamflood pore pressure effect at constant fluid saturation
should not have a significant velocity impact.
suggests, because a
shallow steamflood reservoir has an overburden pressure of about
5 MPa, whereas Han's data are more suited to a reservoir
at 2 km depth and 51 MPa overburden pressure. In summary,
the steamflood pore pressure effect at constant fluid saturation
should not have a significant velocity impact.
vpvs-pp
Figure 2 Compressional and shear wave velocities
in dry Ottawa sandstone versus pore pressure at 51 MPa overburden
pressure (after Han, 1986).
However, consider the situation where the reservoir is just below
the bubble point pressure, such that the the oil saturation relative to
gas is about 90%. If the bubble point pressure is 240 psi, then
the 10% free gas in the reservoir is dissolved back into liquid
oil as the high-pressure front passes by. This situation is
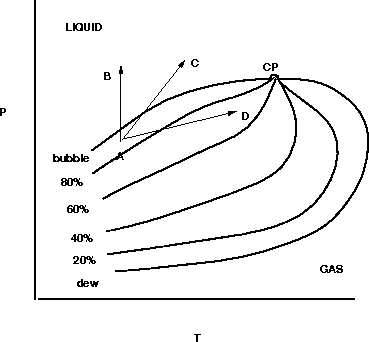
depicted by the path A-B in the hydrocarbon phase diagram of
Figure ![[*]](http://sepwww.stanford.edu/latex2html/cross_ref_motif.gif) : an increase in pressure at fixed temperature
crosses the bubble point line.
The change from an oil saturation of 0.9 to 1.0 can cause a dramatic
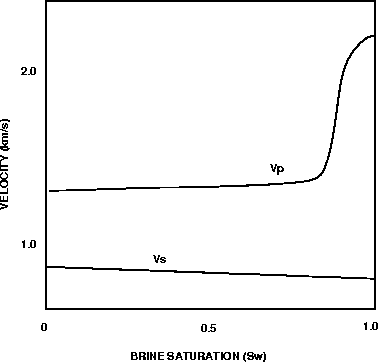
effect in Vp, as first described by Domenico (1977). Figure
: an increase in pressure at fixed temperature
crosses the bubble point line.
The change from an oil saturation of 0.9 to 1.0 can cause a dramatic
effect in Vp, as first described by Domenico (1977). Figure
![[*]](http://sepwww.stanford.edu/latex2html/cross_ref_motif.gif) shows Domenico's experimental results that Vp can
increase by at least 10% in this regime of fluid saturation contrast.
Domenico's results were for brine/gas saturation, but they are equally
applicable to oil/gas for our purposes.
Combining the effects of pore pressure increase and gas saturation
decrease across the bubble point, a net increase of at least 10% is
expected in the high-pressure cold oil front compared to initial
reservoir conditions, as shown in Figure
shows Domenico's experimental results that Vp can
increase by at least 10% in this regime of fluid saturation contrast.
Domenico's results were for brine/gas saturation, but they are equally
applicable to oil/gas for our purposes.
Combining the effects of pore pressure increase and gas saturation
decrease across the bubble point, a net increase of at least 10% is
expected in the high-pressure cold oil front compared to initial
reservoir conditions, as shown in Figure ![[*]](http://sepwww.stanford.edu/latex2html/cross_ref_motif.gif) .
.
hc-phase
Figure 3 Hydrocarbon phase diagram with contours
of liquid oil saturation relative to gas. CP is the critical point,
P-T is the pressure-temperature plane (after Dake, 1978).
vp-sat
Figure 4 Vp and Vs versus brine saturation
for Ottawa sandstone at a differential pressure of 10 MPa
(after Domenico, 1977).
Hot oil zone
Now that we know that the dry-rock effects of pore-pressure increase
alone cause a negligible decrease in Vp, we can focus on the
hydrocarbon phase diagram and temperature effects.
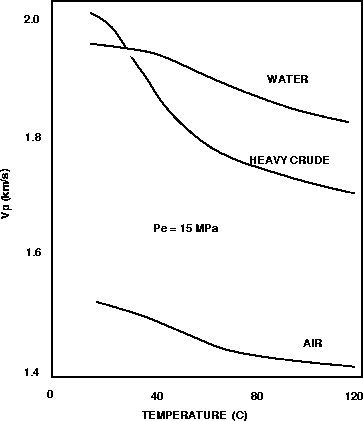
Wang and Nur (1988) performed experiments which showed the effects of
temperature and oil/water/gas saturation on Ottawa sandstone,
as diagrammed in Figure ![[*]](http://sepwww.stanford.edu/latex2html/cross_ref_motif.gif) .
Assuming hot oil displaces original cold oil, in the hot oil
zone of the advancing steam front, Figure
.
Assuming hot oil displaces original cold oil, in the hot oil
zone of the advancing steam front, Figure ![[*]](http://sepwww.stanford.edu/latex2html/cross_ref_motif.gif) shows that
this effect can cause Vp to decrease by as much as 15%.
shows that
this effect can cause Vp to decrease by as much as 15%.
However, when both pressure and temperature increase, the
gas saturation level may also change. To predict the latter, the bubble
point pressure needs to be known for the reservoir oil as a function
of temperature, which is the uppermost contour in Figure ![[*]](http://sepwww.stanford.edu/latex2html/cross_ref_motif.gif) .
Without knowing the exact shape of the phase space, an increase
in both P and T can lead to total gas dissolution (path A-C), or can actually
result in an increase in gas saturation (path A-D).
Normally, one would expect
the bubble point to increase slowly with temperature, such that
a large pore pressure increase from 100 psi to 300 psi at hot oil
temperatures of about 100 C would reduce the gas saturation, or
totally dissolve it (path A-C). This would again increase the
velocity by about 0-10% by the Domenico effect of Figure
.
Without knowing the exact shape of the phase space, an increase
in both P and T can lead to total gas dissolution (path A-C), or can actually
result in an increase in gas saturation (path A-D).
Normally, one would expect
the bubble point to increase slowly with temperature, such that
a large pore pressure increase from 100 psi to 300 psi at hot oil
temperatures of about 100 C would reduce the gas saturation, or
totally dissolve it (path A-C). This would again increase the
velocity by about 0-10% by the Domenico effect of Figure ![[*]](http://sepwww.stanford.edu/latex2html/cross_ref_motif.gif) .
The net effect of temperature increase and some reduction in gas saturation
might make a net impedance decrease of about 10% in the hot oil zone,
as shown in Figure
.
The net effect of temperature increase and some reduction in gas saturation
might make a net impedance decrease of about 10% in the hot oil zone,
as shown in Figure ![[*]](http://sepwww.stanford.edu/latex2html/cross_ref_motif.gif) .
.
Hot water zone
The hot water zone should have a simpler physical behavior compared
to the case of hot/cold high-pressure oil at or near the bubble point.
In this case, both hot oil and any residual gas saturation is largely
driven out by a hot waterflood bank. The Vp contrast should be similar
to moving from the cold oil curve to the hot water curve in Figure
![[*]](http://sepwww.stanford.edu/latex2html/cross_ref_motif.gif) . A net impedance decrease of about 5% is expected
in the hot water zone, as shown in Figure
. A net impedance decrease of about 5% is expected
in the hot water zone, as shown in Figure ![[*]](http://sepwww.stanford.edu/latex2html/cross_ref_motif.gif) .
.
Hot steam zone
When the steam zone arrives, nearly all fluid is driven out of the
pore space, and is the primary mechanism for driving the hot water
zone forward. Figure ![[*]](http://sepwww.stanford.edu/latex2html/cross_ref_motif.gif) shows that the change from
initial cold oil to hot steam causes a dramatic decrease in Vp by
about 30%. Note that about 25% of this decrease is due to
the gas saturation change effect, and only a a further decrease of
5% is added by the thermal effect.
The net effect is an impedance decrease of approximately 30%
in the steamed zone, as shown in Figure
shows that the change from
initial cold oil to hot steam causes a dramatic decrease in Vp by
about 30%. Note that about 25% of this decrease is due to
the gas saturation change effect, and only a a further decrease of
5% is added by the thermal effect.
The net effect is an impedance decrease of approximately 30%
in the steamed zone, as shown in Figure ![[*]](http://sepwww.stanford.edu/latex2html/cross_ref_motif.gif) .
.
vp-temp
Figure 5 Vp measurements as a function of
temperature and saturation with air, water and heavy crude
in Ottawa sandstone (after Wang and Nur, 1988).
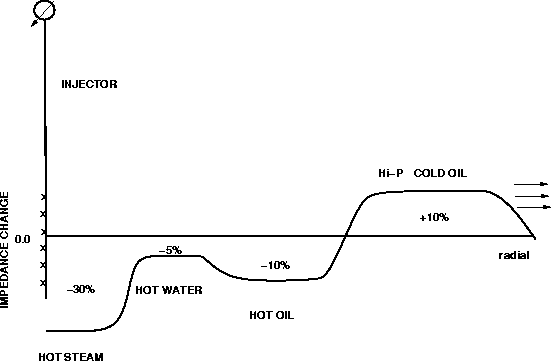
steam-dIp
Figure 6 Predicted steamflood P-impedance changes
compared to initial reservoir conditions as a function of
dimensionless radial distance.
Impedance contrast profile
Figure ![[*]](http://sepwww.stanford.edu/latex2html/cross_ref_motif.gif) shows the predicted impedance contrast profile
in the radial direction away from the injector, obtained by combining the
rock physics results above. The rapidly outward-propagating
pressure front leads the thermal fronts,
and if the reservoir is initially just below the
bubble point pressure, the pressure front will appear seismically
as an increase in Vp by at least 10%,
marked by velocity pull-ups and a positive reflection coefficient.
shows the predicted impedance contrast profile
in the radial direction away from the injector, obtained by combining the
rock physics results above. The rapidly outward-propagating
pressure front leads the thermal fronts,
and if the reservoir is initially just below the
bubble point pressure, the pressure front will appear seismically
as an increase in Vp by at least 10%,
marked by velocity pull-ups and a positive reflection coefficient.
The thermal fronts are likely to lag behind the
leading pressure front by many months of steam injection. The
outermost thermal front is likely to contain hot oil and be
characterized by a decrease in Vp of about 10%, including seismic
velocity pull-down and a negative reflection coefficient.
Just behind the hot oil front, a hot water front is likely to exist.
Its decrease in Vp is marginal at 0-5% depending on residual gas
saturation after waterflood, and may be very difficult to observe
in the seismic monitor data. Finally, a small stable steam zone
should surround the injector, perhaps growing in diameter at a very
slow rate. This steam zone has a net decrease in Vp of about 30%
and should be very visible in the seismic monitor data by strong
velocity pull-down and very bright negative reflection coefficient polarity.
SEISMIC PREDICTIONS
A most interesting prediction from this analysis is the
possibility of observing a rapid, outward-propagating pressure front
in 3-D seismic monitoring data.
If the flow path of the trailing thermal front is established by
the leading pressure front, then a map of any current pressure-front
distribution would give not only a picture of where the pressure front
is today, but also which path the
hot oil is likely to follow over the next several months.
If observable, this phenomenon would make a case for predicting future fluid
flow using a current map of the pressure front distribution.
Prediction time would be on the order of months in advance
of the anticipated oil production, since hot oil
would follow the slow thermal front, not the fast pressure front.
If observable,
this phenomenon could be very useful for interactively redesigning
the field development and production plan for the reservoir in
``real time'', using repeated 3-D seismic monitor surveys as a
diagnostic tool.
I am currently working with a 3-D seismic monitoring data set
associated with an active steamflood project. 3-D seismic
surveys are being acquired at regular intervals to monitor
the effects of steam injection. The dataset includes a suite
of well logs, temperature measurements and VSP surveys.
The preliminary results are exciting, and I expect to
report on the field data analysis later this year.
CONCLUSIONS
I have presented an idealized physical model of steamflood fluid-flow
and made rock physics predictions of seismic impedance changes that might
be observable in 3-D surface seismic monitoring data.
A simple model of steamflood was proposed that distinguishes four
fluid-flow phases:
(1) a high-pressure, low-temperature heavy oil zone, (2) a high-pressure,
high-temperature heavy oil zone, (3) a high-pressure, high-temperature water
zone, and (4) a high-pressure, high-temperature desaturated steam zone.
Seismic impedance contrast estimates were predicted for the steamflood
fluid-flow model using experimental results from rock physics.
I have predicted that seismic images might show the presence
of a rapid outward-traveling high-pressure front due to steam injection.
This pressure front could map reservoir heterogeneity and offer
a prediction several months in advance of the future hot oil flowpath.
I am currently testing these ideas on a 3-D field data set.
Preliminary results are exciting and will be published later
this year.
REFERENCES
-
Dake, L. P., 1978, Fundamentals of reservoir engineering: Elsevier, New York.
-
Domenico, S. N., 1977, Elastic properties of unconsolidated porous
sand reservoirs: Geophysics, 42, 1339-1368.
-
Eastwood, J., Lebel, P., Dilay, A., and Blakeslee, S., 1994,
Seismic monitoring of steam-based recovery of bitumen:
The Leading Edge, 13, 242-251.
-
Ito, H., DeVilbiss, J., and Nur, A., 1979, Compressional and shear waves
in saturated rock during water-steam transition: Journal of
Geophysical Research, 84, 4731-4735.
-
Lake, L. W., 1989, Enhanced oil recovery: Prentice-Hall Inc., New Jersey.
-
Nur, A., 1989, Four-dimensional seismology and (true) direct detection
of hydrocarbons: the petrophysical basis: The Leading Edge, 9,
30-36.
-
Pullin, N. E., Jackson, R. K., Matthews, L. W., Thorburn, R. F.,
Hirsche, W. K., and den Boer, L. D., 1987, 3-D seismic imaging
of heat zones at an Athabasca tar sands thermal pilot: 57th
Annual Internat. Mtg., Soc. Expl. Geophys., Expanded Abstracts,
391-394.
-
Wang, Z., and Nur, A., 1988, Effect of temperature on wave velocities
in sands and sandstones with heavy hydrocarbons: SPE Reservoir
Engineering, 3, 158-164.


![[*]](http://sepwww.stanford.edu/latex2html/prev_gr.gif)


Next: About this document ...
Up: Table of Contents
Stanford Exploration Project
5/15/2001
![[*]](http://sepwww.stanford.edu/latex2html/cross_ref_motif.gif) .
This model is slightly more complicated than the conventional block
model of a heated zone and a cold zone, but does not try to incorporate
the complexity of mixed fluid phases, emulsions, fingering, gravity
overrides, etc., as described by Lake (1989) for example.
.
This model is slightly more complicated than the conventional block
model of a heated zone and a cold zone, but does not try to incorporate
the complexity of mixed fluid phases, emulsions, fingering, gravity
overrides, etc., as described by Lake (1989) for example.
![[*]](http://sepwww.stanford.edu/latex2html/prev_gr.gif)
