![[*]](http://sepwww.stanford.edu/latex2html/prev_gr.gif)
ABSTRACTPrestack Kirchhoff migration using first arrival traveltimes has been shown to fail in areas of complex structure. I propose a new method for calculating traveltimes that estimates the traveltime of the maximum energy arrival, rather than the first arrival. The method estimates a traveltime that is valid in the seismic frequency band, not the usual high frequency approximation. Instead of solving the eikonal equation for the traveltime, I solve the Helmholtz equation to estimate the wavefield for a few frequencies. I then perform a parametric fit to the wavefield to estimate a traveltime, amplitude, and phase. The images created by using these parameters are shown to be superior to those created by using first arrival traveltimes, or those created using maximum amplitude traveltimes calculated by paraxial ray tracing. |
Several authors have noted problems when first-arriving traveltimes are used in prestack Kirchhoff migration. The method appears to fail when complex velocity models are used. A good example of this is the failure of first arrival traveltimes to image the Marmousi dataset (). This dataset was created specifically to test prestack velocity analysis and imaging algorithms (). When the true velocity model was released, it became clear that the dataset could be imaged successfully with algorithms that used recursive extrapolation of the full wavefield but it was not well imaged by non-recursive Kirchhoff migration algorithms.There are two possible reasons for this:
In this paper I propose a method that addresses both of these limitations. As with most methods, the Green's functions are approximated by a single event model. The model is parameterized by a traveltime, amplitude and phase at each point. In my method the traveltime chosen is the traveltime of the maximum energy arrival, not the first arrival. This is the best single event approximation to the full Green's function (in the L2 norm). The traveltime is not calculated from a solution to the eikonal equation. Instead the parameters are estimated from solutions to the Helmholtz equations at a few frequencies in the seismic frequency band. This ensures that the traveltimes chosen are representative of traveltimes for waves in that frequency band.
BAND-LIMITED GREEN'S FUNCTIONS
The most common model for a Green's function is one that parameterizes the Green's function in terms of ``arrival time'' and ``amplitude''. This parameterization has the advantage that these quantities can be used directly in time domain Kirchhoff migration or modeling schemes. The Green's function can be characterized by one or more ``events'' that arrive at each location. Parameterization by a traveltime implies that the phase is a linear function of frequency for each event.
The justification for this event based model can be seen by looking at any seismic section. The data is not a random mish-mash of unrelated amplitudes, it has the appearance of a set of distinct events arriving at different times. The fact that distinct events are visible means that many frequencies are arriving at the same (or nearly the same) time and are constructively combining to produce a band-limited event. This implies that the phases of the different frequencies for each event are not random; they must follow an approximately linear trend as a function of frequency.
A simple way of estimating a traveltime that is valid in the seismic frequency band is to compute the full wavefield and then pick the maximum energy arrival at each location. Indeed, this method has been used for the imaging condition in shot-profile migration (). Unfortunately this method is very expensive, if the modeling is performed in the frequency domain, it requires a finite-difference solution to the wave equation for every frequency in the data. In contrast, a fast, explicit, eikonal solver () requires only one finite-difference calculation. The question that I attempt to answer is ``How few frequencies can we compute and still recover the correct traveltime?''
Single event models
The simplest models are parameterized by one event. The simplicity of this model is very appealing but it is only valid in very smooth velocity fields. In a complex velocity field there are multiple paths from the source to one subsurface location, and thus multiple events. I will start by considering single event models and then progress to multiple event models.
When there is only one un-dispersed arrival at each location, the
Green's function from source location, ![]() , to subsurface
location,
, to subsurface
location, ![]() , can be represented in terms of the amplitude,
, can be represented in terms of the amplitude,
![]() , traveltime,
, traveltime, ![]() , and
phase,
, and
phase, ![]() , of that arrival. I assume here that
the arrival is an impulsive event with a constant phase shift.
, of that arrival. I assume here that
the arrival is an impulsive event with a constant phase shift.
![]()
The total phase at any frequency is ![]() . The slope of the total phase gives the
traveltime and the intercept at zero frequency gives the constant
phase shift. If the Green's function fits this model then linear
interpolation of unwrapped phase will exactly recover the phase for
all frequencies. The amplitude is constant for all frequencies.
. The slope of the total phase gives the
traveltime and the intercept at zero frequency gives the constant
phase shift. If the Green's function fits this model then linear
interpolation of unwrapped phase will exactly recover the phase for
all frequencies. The amplitude is constant for all frequencies.
If, for the given velocity field, we know that there is only one
non-dispersed arrival, we need only extrapolate two frequencies. The
amplitude and unwrapped phase at each location provide enough
information to completely specify the Green's function at that
location.
From the amplitude, ![]() , and unwrapped phase,
, and unwrapped phase,
![]() , at two frequencies
, at two frequencies ![]() and
and
![]() we have:
we have:
The average amplitude,
![]()
The slope of the unwrapped phase,
![]()
The unwrapped phase intercept at zero frequency,
![]()
If it can further be assumed that all the arrivals are zero phase then only one frequency is needed, as we have the implied condition that the phase at zero frequency is zero.
![]()
![]()
Implicit in many asymptotic schemes is the assumption that total phase is a linear function of frequency for all frequencies from zero to very high frequencies. If this is not true the asymptotic methods may give solutions that are inappropriate for the seismic bandwidth. In contrast the simple interpolation of two frequencies in the seismic frequency band only assumes that phase is a linear function over that band.
Multiple events
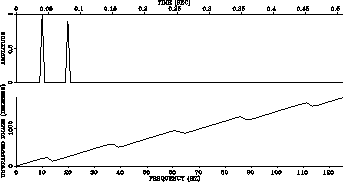
When there are multiple arrivals at a single location the phase is
no longer a linear, or even a smoothly varying, function of frequency.
Consider the case of two arrivals with amplitudes A1, A2 and
traveltimes ![]() and
and ![]() . The wavefield is a linear superposition
of the two arrivals.
. The wavefield is a linear superposition
of the two arrivals.
![]()
 |
A non-linear problem
To fit an n-event model to the calculated mono-frequency Green's functions, we
must find amplitudes, Ai, phases, ![]() , and traveltimes,
, and traveltimes, ![]() ,such that the calculated Green's function,
,such that the calculated Green's function, ![]() , is predicted correctly
for all modeled frequencies.
, is predicted correctly
for all modeled frequencies.
![]()
![]()
A different approach to the problem can be taken by noticing that it is the dual of a much more familiar problem. In geophysics, we often have a sampled time series and we wish to estimate a sparse, spiky, frequency spectrum. In this case we have a sampled frequency series and we wish to estimate a sparse, spiky, time-domain representation. A large number of existing algorithms could be adapted for this task. Many parametric spectral analysis methods are available, some have been used in seismic signal deconvolution (, ), others have been used for high resolution spectral analysis in other fields (, , ). I chose to first try a very simple method based on the Fourier transform. This scheme was so successful that I did not experiment with the more complex methods. It is possible that the more complex methods can accurately estimate the traveltimes from Green's functions at fewer frequencies. This would be important if the cost of calculating one frequency is large.
Event identification in the time domain
One simple way to identify the events is to inverse Fourier transform the data back to the time domain.
![]()


When transformed back to the time domain the wavelet shapes and traveltimes of the true wavefield are not lost. The wavefield is merely replicated at regular intervals, it is aliased in time. If the aliases do not overlap, and the approximate position of the true alias is known then it can be uniquely retrieved.
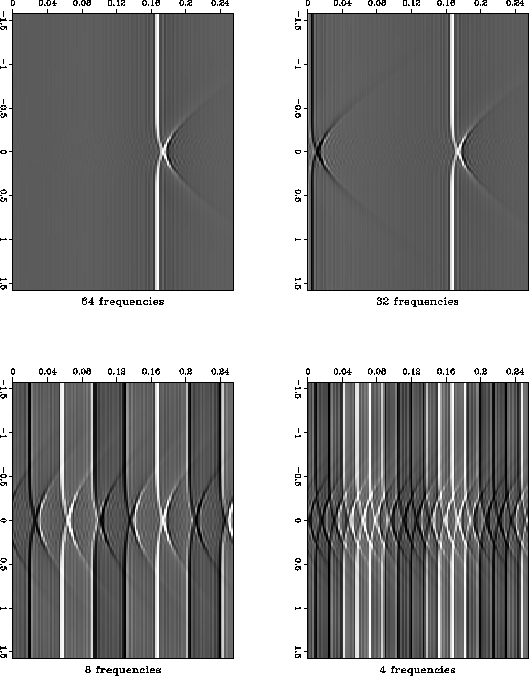 |
In order to track the correct alias I perform the calculation in a polar coordinate frame. Once I have calculated the wavefield in the frequency domain I can attempt to estimate the traveltime/amplitude/phase that best fits the wavefield. If I know the correct traveltime at one radius I can predict the position of the correct alias of the wavefield at the next radius. Given that knowledge, I can pick the correct maximum-energy traveltime. By extrapolating both the traveltime field, and the wavefield, outwards from the origin I am able to overcome the problems caused by aliasing. Figure aliases shows the wavefield at one radius for a medium with a circular velocity anomaly. The top left frame used all sixty-four frequencies, the top right frame used thirty-two, the bottom left used eight and the bottom right used four. It is clear that if we know which is the true alias, it can be separated from the others in all the plots except the one created using four frequencies.
In my algorithm a small number of frequencies (8-16) in the seismic frequency band are extrapolated outwards from the source location using a paraxial one-wave equation in polar coordinates (). The traveltime and wavefield are both known at the origin and they are extrapolated outwards to fill the whole space. At each radius the wavefield is parameterized by a traveltime/amplitude/phase triplet. The traveltime is chosen to correspond to the traveltime of the maximum energy event at each location.
The algorithm at each radius is as follows.
The cost of this algorithm is surprisingly modest. In a constant velocity model it costs about 8 times as much as an explicit finite-difference solution to the eikonal equation. In a complex model the cost of the two algorithms is about the same. In the complex velocity model, the explicit eikonal solver must use very small radial steps to remain stable. The band-limited Green's function calculation is based on a stable wavefield extrapolator, so the grid, and hence the cost, is independent of model complexity.
The band-limited Green's functions have several desirable properties:
GREEN'S FUNCTIONS IN THE MARMOUSI MODEL
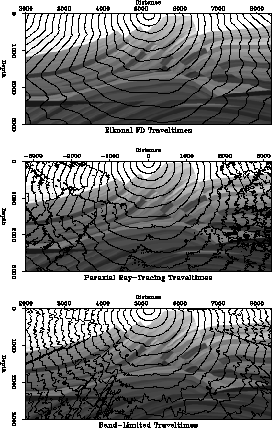
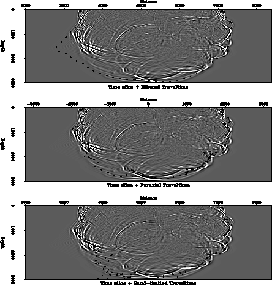
Figure ttmaps shows traveltime contours in the Marmousi velocity model. The top frame is a first arrival traveltime field calculated by a finite-difference solution to the eikonal equation. The center frame is a maximum amplitude traveltime field calculated by paraxial ray-tracing, the bottom frame is the maximum energy traveltime field calculated using my method. The lower two estimates are discontinuous but they are both a better fit to the significant energy in this model. This is illustrated in figure all-tov-1.1, each frame is one snapshot of the modeled impulse response with the traveltime contour for that time superimposed. The top frame is shows the traveltimes from a finite difference solution to the eikonal equation. The middle frame shows the traveltimes from paraxial ray tracing. The bottom frame shows the band-limited traveltime.
 |
![[*]](http://sepwww.stanford.edu/latex2html/movie.gif)
 |
![[*]](http://sepwww.stanford.edu/latex2html/movie.gif)
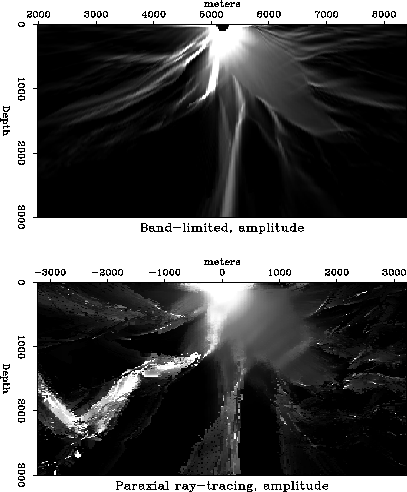
Figure comp-amp shows a comparison of the amplitude estimates for the paraxial ray-tracing and the band-limited Green's functions. The estimate made in the seismic frequency band is much smoother and it does not show any of the instability associated with caustics that can cause problems when using ray traced Green's functions.
 |
![[*]](http://sepwww.stanford.edu/latex2html/movie.gif)
Imaging the Marmousi dataset
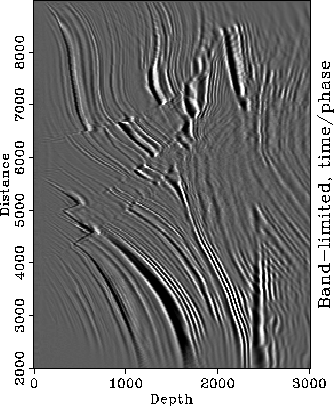
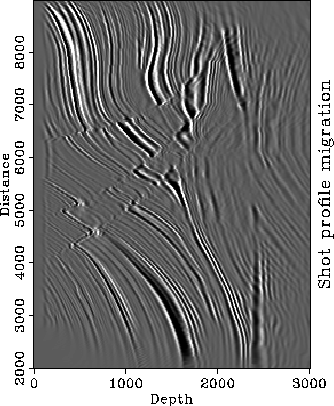
In another paper in this report a full comparison is made between the results of Kirchhoff migration using the Green's functions created using my method, and migration images created using other methods (). In this paper I will only show two images. The first, Figure marm-tp, is the result of Kirchhoff migration using just the traveltime and phase information from my band-limited Green's functions. The second, Figure mig-shot-prof, is the result of full wavefield shot profile migration using a correlation imaging condition. Both of these methods produce structural images rather than reflectivity estimates. The two images are very similar, Kirchhoff migration can produce good images in a complex model as long as the Green's functions are good estimates of the full wavefield.
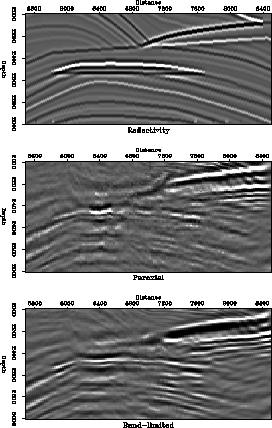
It is also possible to create a reflectivity estimate using Kirchhoff migration/inversion (). Figure refl shows a close-up of the reflectivity estimates in the target zone of the Marmousi model. The top frame is a bandpass filtered version of the true reflectivity, the center frame is the reflectivity estimate created using paraxial ray tracing, the bottom frame is the estimate created using band-limited Green's functions. The bottom frame has a more continuous image and it is a better match to the true reflectivity than the center frame.
 |
![[*]](http://sepwww.stanford.edu/latex2html/movie.gif)
 |
![[*]](http://sepwww.stanford.edu/latex2html/movie.gif)
 |
CONCLUSIONS
I have presented a new method for estimating Green's functions in complex media. As in many traditional methods, the Green's functions are parameterized by a traveltime/amplitude/phase triplet at every point in the model. However these parameters are not calculated using a high frequency approximation. Instead the solution to the Helmholtz equation is computed at a few frequencies in the seismic frequency band. The parameters are then chosen to represent a maximum energy arrival that fits these solutions.
Prestack Kirchhoff migration images created using these ``band-limited Green's functions'' are superior to those created using other traveltime estimation methods. They are very close in quality to the images created by full wavefield extrapolation methods.
[MISC,EAEG,GEOTLE,SEP,SEGCON,SEGBKS,geophysics]
![[*]](http://sepwww.stanford.edu/latex2html/prev_gr.gif)