| substance | K [MPa] | vp [m/s] | vs [m/s] | ||
| water | 2250 | 1000 | 1500 | ||
| pure hydrate | 5600 | 2400 | 767 | 3450 | 1770 |
| ice | 6650 | 2550 | 916 | 3310 | 1670 |
| gas | 10 | 100 | 375 |
![[*]](http://sepwww.stanford.edu/latex2html/prev_gr.gif)
ABSTRACTSeismic analyses of methane hydrate data from the Blake Outer Ridge indicate high P-wave velocity and anomalously low S-wave velocity in sediments containing methane hydrates. In an attempt to explain this observed P-wave and S-wave velocity structure at the transition from gas to hydrates, the effect of different hydrate models on elastic moduli and velocities are explored. After construction of an initial gas model, the properties of the hydrates are estimated using the bound averaging method together with the Voigt and Reuss bounds for elastic moduli. The result suggests that the hydrates becomes part of the rock matrix and softens the pores by fracturing. The additional formation of ice is required to obtain the desired P- to S-wave velocity ratio in the hydrate bearing sediments, indicating temperature conditions around the freezing point of water. |
Methane hydrates are ice-like, crystalline lattices of water molecules in which gas molecules are trapped physically without the aid of direct chemical bonds. They form only under certain pressure and temperature conditions which limit their occurence to polar and deep oceanic regions. Due to the enormous amount of methane that is apparently sequestered within hydrate structures, they are likely to have a ``greenhouse'' effect on future global climate (), and might also be an important future energy source (). Therefore, a good understanding of the characteristics and properties of the hydrate deposits is essential. However, only limited information is available from deep-sea drilling due to the high instability of the hydrate. Thus, information such as acoustic velocity and resistivity is mostly inferred from seismic reflection data (, , , ). Although the properties of pure methane hydrate were determined in several lab measurements (, ), the properties of an in situ hydrate deposit is still quite controversial.
One of the first regions that was associated with the occurence of methane hydrates is on the eastern United States margin, offshore Florida, on the Blake Outer Ridge. Deep-sea drilling on the Blake Outer Ridge () found high methane content below a subbottom depth of 50 m. Furthermore, approaches to estimate the amount of hydrate in this region (, ) suggested a significant amount of hydrate above the stability zone. Seismic investigations (, ) indicated a considerable increase of compressional wave velocity in the hydrate. Based on AVO amplitude responses and impedance estimations, Ecker and Lumley showed that the hydrate layer is characterized not only by high P-wave velocity but also by anomalously low S-wave velocity. The hydrate layer seemed to be underlain by a thick gas layer having lower P-velocity but considerably higher S-velocity than the hydrate.
This study is a first attempt to explore the effects of different hydrate structures on the elastic moduli and velocities, and compare them with those obtained by Ecker and Lumley . In this way, a clear discrimination between different models is possible and should give a good insight into the possible hydrate structure at the Blake Outer Ridge.
In this paper I discuss the properties of several hydrate structures which
were obtained by modeling a transition from gas saturated sediments to
sediments containing methane hydrate.
An initial gas saturated, shaly sand model is
constructed by using deep-sea drilling information and the seismic velocity
information given by Ecker and Lumley .
The bound averaging method for fluid substitutions is then used together
with the Voigt and Reuss bounds to model the elastic moduli of hydrate layers
with different mechanical structures. The resulting moduli are converted
into velocities and compared with those obtained by the seismic study.
Although the high clay content in the sediments in this area introduces a
significant uncertainty in the moduli and velocity calculations, a clear
trend in the behavior of the hydrate properties can be observed for the
different structures.
POSSIBLE HYDRATE STRUCTURES Based on the seismic analysis performed by Ecker and Lumley on data from the Blake Outer Ridge, it can be assumed that the high velocity hydrate layer ( 2.5 km/s) is underlain by a gas layer having a P-wave velocity of approximately 1.6 km/s. Furthermore, the study showed that the hydrate layer has to be characterized by anomalously low S-wave velocity of around 0.5 km/s which increases to 1.1 km/s in the gas saturated sediments, in order to explain the AVO data. The estimated velocities in the gas layer yield a Poisson's ratio of 0.1 which is consistent with free gas.
Several different hydrate structures can be imagined to explain this considerable increase in S-wave velocity and simultaneous decrease in P-wave velocity at the transition from hydrate bearing sediments to sediments containing free gas. The simplest model can be best described as a so-called ``slush'' model. As the gas/water pore fluid in the sediments reaches the base of the hydrate stability zone, it is transformed into a mixture of hydrate and water, i.e. a slush. This resembles a simple substitution of the pore filling while the properties of the actual rock matrix remain unchanged. The model assumes that the pressure-temperature conditions at the transition zone allow the formation of hydrate at temperatures above the freezing point of water. In the case of lower temperatures, part of the water might freeze in which case the gas/water pore filling is converted into a hydrate/ice/water slush which will affect the elastic properties in a different way.
Another possible way to model the transition from gas to hydrate is to assume that the hydrate becomes part of the rock matrix which would result in a decrease of the porosity of the composite. An important factor in this model is the influence of the methane solidification on the rock matrix. One possibility is that the hydrate formation and addition to the rock matrix causes fracturing of the sediments, thus causing some of the pores to become crack-like and compliant. On the other hand, there might be no change in the stiffness due to the freezing of the methane at all. Again, the temperature at the transition zone might be an important factor, also for the additional formation of ice which would reduce the porosity of the mixture even further.
The properties of hydrate, water, ice, and gas used to construct the different hydrate structures are shown in Table 1. The gas properties are valid for a pressure of 10MPa which is a realistic assumption for the depth of the gas-hydrate transition zone at the Blake Outer Ridge.
| substance | K [MPa] | vp [m/s] | vs [m/s] | ||
| water | 2250 | 1000 | 1500 | ||
| pure hydrate | 5600 | 2400 | 767 | 3450 | 1770 |
| ice | 6650 | 2550 | 916 | 3310 | 1670 |
| gas | 10 | 100 | 375 |
MODELING TECHNIQUE
In order to estimate the actual effects of the hydrate structures proposed in the preceding section on the elastic and acoustic properties of hydrate bearing sediments, I used the so-called Bound Averaging Method (BAM) by Marion . This method estimates the changes in elastic moduli and velocities that result from substituting one pore-filling material with another.
The estimation of the moduli for a volume mixture of minerals and pore fluids requires the incorporation of the following parameters:
If the stiffness of the mixture is not known, only upper and lower bounds can be specified for the moduli. At any given composition of the phases, the effective modulus will fall between the bounds. Its precise value, however, can not be determined as it depends on the stiffness of the given phase state. A mixture containing stiff pores will be located along the upper bound while a mixture containing soft pores will be located along the lower bound. Strictly empirical bounds are the so-called Voigt and Reuss bounds which give the ratio of average stress and average strain within the composite. For the Voigt upper bound, the strain is assumed to be uniform everywhere. The Reuss lower bound assumes a state of uniform stress within the entire mixture.
For a compound of mineral and pore fluid, the Voigt upper bound is given by:
| (1) |
| (2) |
with: ![]() = porosity = volume fraction of the pore fluid
= porosity = volume fraction of the pore fluid
Mmin = elastic modulus of the mineral
Mfluid = elastic moduli of the pore fluid
If the mineral is composed of several constituents, the effective moduli for the pure mineral without any pores are determined using the Voigt-Reuss-Hill average:
| (3) |
The Voigt and Reuss bounds are obtained by replacing the moduli and porosity in equations equation1 and equation2 above with the moduli of the individual constituents and its volume fractions, respectively, and summing over the number of constituents. The actual moduli of a multi-component pore fluid is obtained by just using the Reuss bound with the individual moduli and volume fractions, and summing over them.
Knowing the elastic modulus of a given mixture, the bound averaging method (BAM) assumes that the fractional vertical position of the modulus within the bounds, w, is a measure of the stiffness of the mixture. Presuming that w is independent of the pore filling properties, it should remain constant with any change in pore fluid. Thus, the elastic properties of a new composite can be determined from an initial composite. The realization of the BAM method is shown in Figure bam.
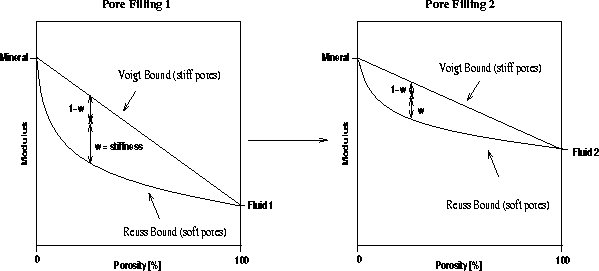 |
First, the elastic modulus of an initial model with pore filling 1 and its resulting Voigt and Reuss bounds for different volume mixtures are determined. The stiffness parameter w of the initial state is given by the position of the elastic modulus between the bounds. The Voigt and Reuss bounds are then recalculated for a pore filling material 2. As w remains constant for the transition from filling 1 to filling 2, the elastic modulus of the new composite can be obtained by determining the modulus value at the fractional position w between the new bounds.
If the composite undergoes a change in porosity, an additional linear interpolation is required. Keeping the porosity constant, the initial state is converted using the BAM method. Then, the porosity of this state is changed by linear interpolation between the upper and lower bounds. From the resulting position, the elastic modulus of the final state is obtained.
In case of an additional change in stiffness, as can be expected by substituting a fluid pore filling with a frozen one, the elastic modulus is determined in a similar way. The initial state is again transformed using the BAM method. After having determined the new position between the upper and lower bounds, the mixture can be softened by moving it closer to the Reuss bound, or stiffened by moving it closer to the Voigt bound. Having accounted for this change in the stiffness parameter, linear interpolation to a new porosity is possible.
The resulting elastic moduli are converted into velocity information using the following relationships between P-wave velocity, S-wave velocity, bulk modulus, shear modulus and density:
 |
(4) |
| (5) |
The effective density of a two phase mixture is obtained by:
| (6) |
where fi and ![]() represent the volume fractions and densities of the
individual phases.
represent the volume fractions and densities of the
individual phases.
CONSTRUCTION OF THE INITIAL MODEL
Results from deep sea drilling at the Blake Outer Ridge suggest high concentrations of clay within the sediments. The effects of clay on the elastic properties of shaly sandstones are still quite speculative and many different possible correlations exist between clay content and acoustic and elastic properties of sandstone. Due to the relatively high scattering in the possible properties of shaly sandstone, a large uncertainty is introduced into all calculations in this study.
Based on the velocity information given by Ecker and Lumley , I assume the actual gas saturated sediments to have a P-wave velocity of 1.6 km/s and a S-wave velocity of approximately 1.1 km/s.
Using the given velocity and mineral information for the Blake Outer Ridge, a gas layer was constructed which could fulfill the velocity requirements. Using Han's empirical relationship for water saturated, clay-bearing sandstones,
| (7) |
| (8) |
in which ![]() gives the porosity and C gives the clay content, the
properties of water saturated, shaly sandstones were determined for clay
concentrations between 45% and 65% and porosities between 0% and 45%.
The water was then replaced with water-gas mixtures having different gas
concentrations. The properties of water and gas that were
used for this substitution were shown in Table 1.
The resulting P- and S-wave
velocities for the different mixtures were then compared with the given
velocities. Figure velocity shows the P- and S-velocities versus porosity
for different clay concentrations and two different saturations.
gives the porosity and C gives the clay content, the
properties of water saturated, shaly sandstones were determined for clay
concentrations between 45% and 65% and porosities between 0% and 45%.
The water was then replaced with water-gas mixtures having different gas
concentrations. The properties of water and gas that were
used for this substitution were shown in Table 1.
The resulting P- and S-wave
velocities for the different mixtures were then compared with the given
velocities. Figure velocity shows the P- and S-velocities versus porosity
for different clay concentrations and two different saturations.
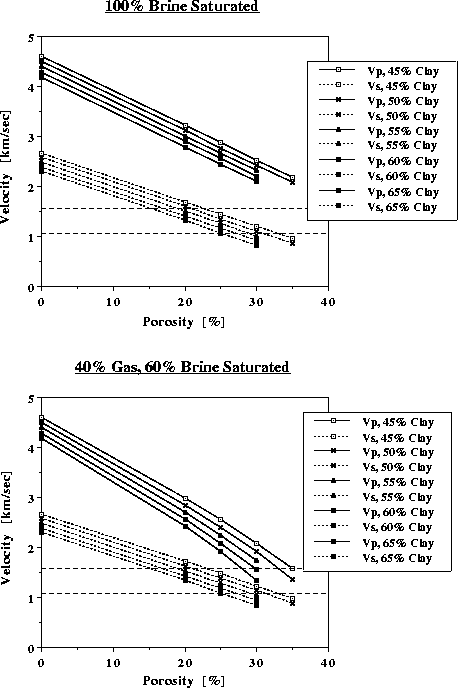 |
Assuming no gas saturation in the sediments, the desired P- and S-wave velocities can not be obtained. Saturating the shaly sediments with a 40% gas - 60% water mixture decreases the P-wave velocities for all clay concentrations considerably. The S-wave velocities remain approximately constant. The P- to S-wave ratio, however, is for all settings slightly higher than the given one. This is caused by the use of Han's empirical relationship for saturated shaly sandstones, which might not resemble the realistic conditions. Nevertheless, it should give a reasonable approximation for this first modeling attempt.
Based on the determined velocities and P- to S-wave ratios for the different clay concentrations, I assumed the sediments to have around 55% clay concentration and a porosity of approximately 31%. As the P-wave velocity remains approximately constant after a gas saturation of only a few percent, the S-wave velocity, however, slightly increases with increasing gas concentration, I choose a 60% gas - 40% water saturation to improve the P- to S-wave ratio. This model yields a P-wave velocity of approximately 1.65 km/s and an S-wave velocity of approximately 1.0 km/s. The properties of the pure mineral and the water-gas mixture of this initial model are shown in Table 2.
| substance | K [MPa] | ||
| mineral | 27700 | 15400 | 2500 |
| fluid | 16.62 | 460 |
The bulk and shear moduli of the mineral were obtained by using the previously determined velocities for a sandstone containing 55% clay. As the density of sandstone does not vary much with clay concentration, an averaged density of 2500 kg/m3 was assumed. The properties of the gas-water mixture were determined from the parameters listed in Table 1. The so obtained initial model serves as an input for the BAM method. It is shown in Figure in1-ann.
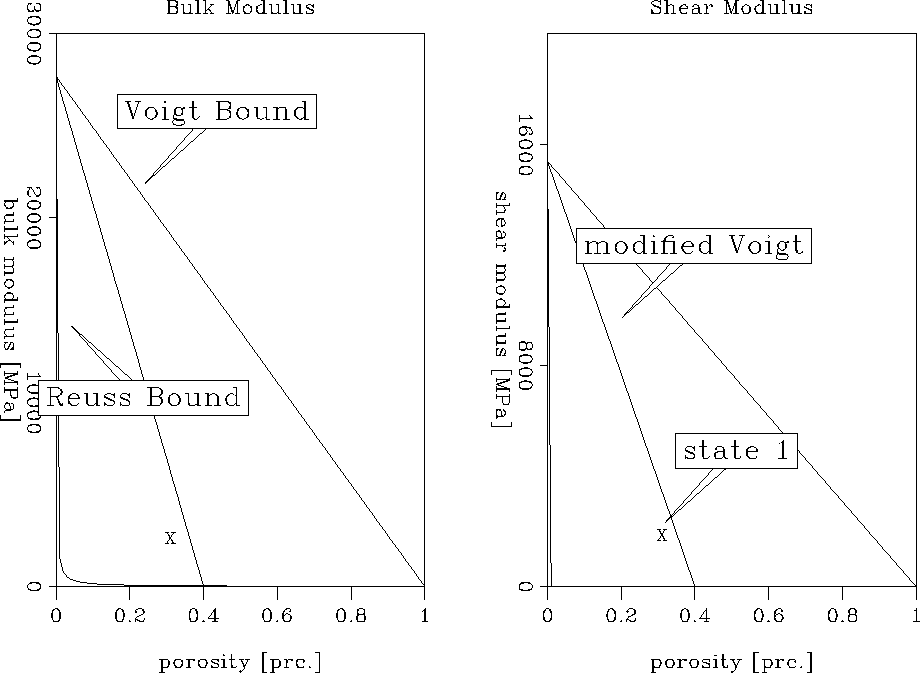 |
The modified Voigt bound in Figure in1-ann describes the expected behavior of porous material for a porosity smaller than the critical porosity of the material (). For porosities lower than the critical porosity, the mineral grains are load-bearing, while for greater porosities the sediments become a suspension. The critical porosity for shaly sand is assumed to be approximately 40%. The elastic moduli for the initial model, described as state 1 in the Figure, fall well within the load-bearing domain.
HYDRATE MODELING
1. SLUSH MODEL
Hydrate/water slush
In this first modeling approach, the 60% gas - 40% water saturation of the
initial sediments is substituted with a 60% hydrate - 40% water mixture.
The porosity and stiffness of the whole composite remains unchanged.
Using the properties of hydrate and water specified in Table 1, the properties
of the hydrate/water slush can be obtained from equations equation2 and
rho:
Kslush = bulk modulus = 3510 MPa
![]() = shear modulus = 0 MPa
= shear modulus = 0 MPa
![]() = 860 kg/m3
= 860 kg/m3
Although
pure hydrate has a shear modulus of approximately 2400 MPa, the shear modulus
of the hydrate-water pore filling is set to zero. It can be assumed that even
for small amounts of water a slush has absolutely no shear strength.
The resulting bulk and shear modulus of the hydrate model are compared with
those of the initial gas model in
Figure final1-ann.
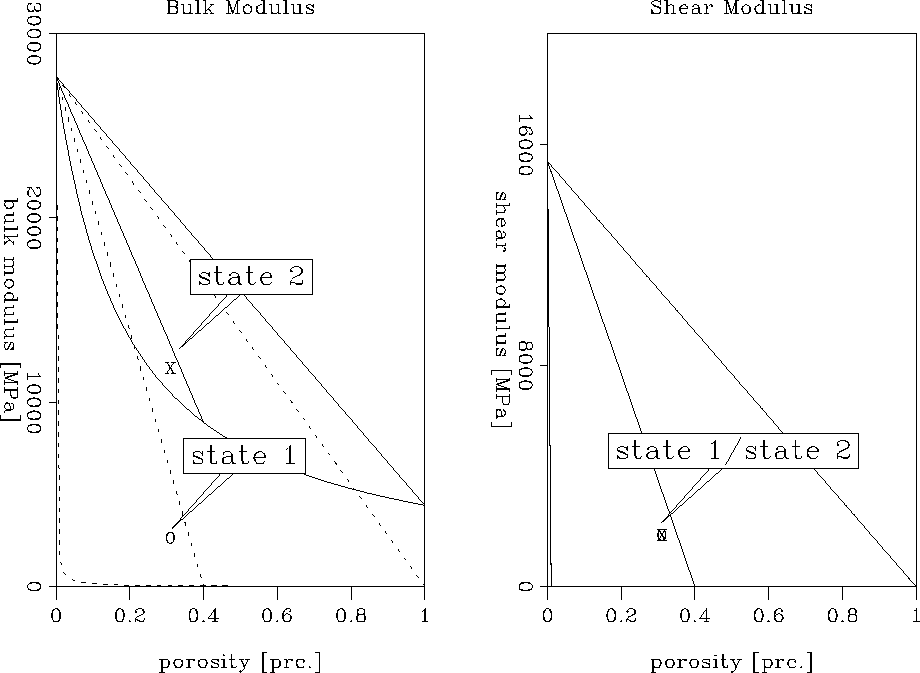
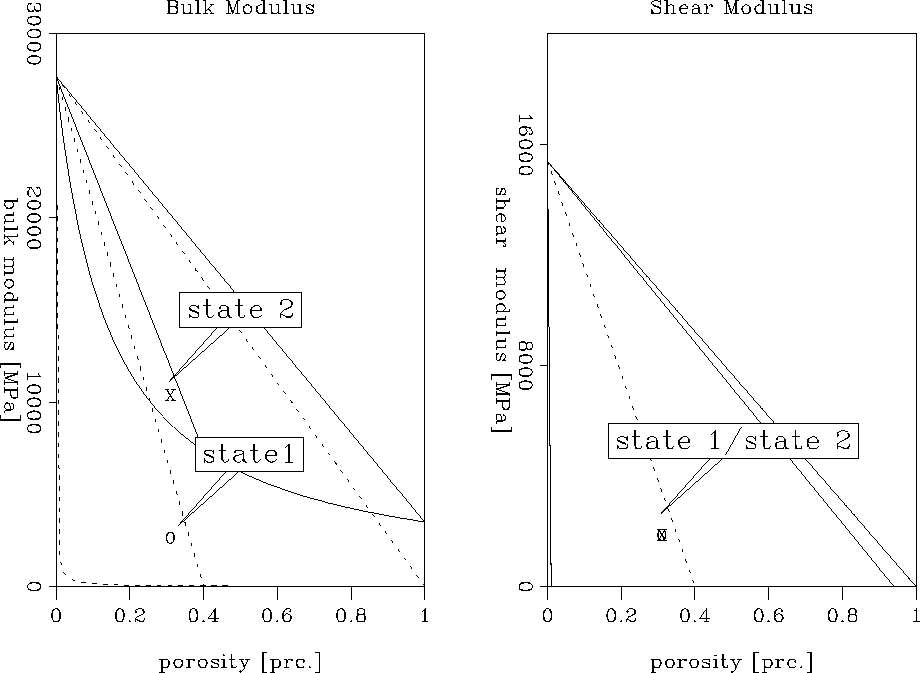 |
Based on the increase in the bulk modulus of the pore filling by
substituting gas/water with a hydrate/water slush, the upper and lower bounds
for the bulk modulus are much narrower. The actual bulk modulus of the
new composite, marked as state 2 in Figure final1-ann, is considerably
higher than that of the initial composite, marked by state 1. This indicates
a lower compressibility of the new mixture due to the additional strength of
the hydrate. As the shear modulus of both pore
fillings was assumed to be zero, the Voigt and Reuss bounds remain the same
for the change in pore fluid. Therefore, the resulting shear modulus of the
hydrate/water bearing sediments is identical with the one of the sediments
containing gas and water. Both mixtures have low shear strength.
Thus, replacing a gas/water pore filling with a hydrate/water slush increases
the bulk modulus significantly but leaves the shear modulus constant.
Using the bulk
and shear moduli marked as state 2 in Figure final1-ann, the actual P- and
S-wave velocity can be determined to be:
vp = 2.60 km/s
vs = 0.97 km/s
The increase of the P-wave velocity from 1.65 km/s in the gas model to 2.6 km/s
in the hydrate model resembles the increase observed in the seismic data.
However, the decrease in the S-wave velocity which is based solely on the
change in density as the shear properties remain constant for the pore-filling
substitution, is negligibly small. Thus, a transition from gas/water to a
hydrate/water slush seems unreasonable.
Hydrate/water/ice slush
In this model it is assumed that the temperature at the base of the hydrate
stability zone allows the formation of ice. In this case, the gas/water mixture
transforms into slush containing hydrate, ice, and a small amount of remaining
water. Considering a 60% hydrate, 20% ice, and 20% water mixture, the
following properties of the slush are calculated using equations
equation2 and rho:
Kslush = 4420 MPa
![]() = 0 MPa
= 0 MPa
![]() = 843 kg/m3
= 843 kg/m3
The shear modulus was again set to zero presuming zero shear strength of the
slush. Therefore, regarding the preceding model, only a change in bulk modulus
and thus P-wave velocity is expected. The result of the pore filling
substitution can be seen in Figure final2-ann.
 |
Due to the additional ice in the slush, the bulk modulus of this model
increased even more than that in the previous one. As predicted, the
shear modulus remained constant. Converting the moduli into velocities yields:
vp = 2.77 km/s
vs = 0.97 km/s
Comparing these velocities with those obtained with the hydrate/water slush
model, it is obvious that the presence of ice increased the P-wave velocity
further. However, as the addition of ice to the slush does not change the
shear strength and leaves the density fairly unchanged,
a hydrate/water/ice slush also does not result in a desired
increase of the P-wave velocity and a decrease in S-wave velocity.
The slush model can be further modified by changes in the gas and thus hydrate content, but its characteristic of having no shear strength and only considerable small changes in density will always yield a relatively small decrease in the S-wave velocity. Consequently, a slush model is not a realistic representation of the hydrate structure at the Blake Outer Ridge.
2. Matrix Model No change in stiffness In this modeling approach the hydrate that forms when the gas comes in contact with the base of the hydrate stability zone becomes part of the mineral. The resulting composite is 100% water saturated and has a reduced porosity. The solidification of the methane is assumed not to change the stiffness of the rock. The initial model of 69% mineral and 31% pore fluid consisting of 60% gas and 40% water is thus transformed into 88% mineral and 12% pore fluid consisting of 100% water. In contrast to the slush model, both the properties of the pure mineral and the pore filling of the hydrate bearing sediments have changed. Using the parameters given in Table 1 and Table 2, and the equations for the Voigt bound, Reuss bound, and Voigt-Reuss-Hill average, the properties of the pure mineral and the pore fluid are determined and shown in Table 3.
| substance | K [MPa] | ||
| mineral | 18800 | 9650 | 2120 |
| fluid | 2250 | 1000 |
A comparison with the properties of the initial model given in Table 2 shows that the addition of hydrate to matrix has decreased both the mineral bulk modulus and the shear modulus considerably. The replacement of the gas/water pore filling with water leads furthermore to a significant increase of the fluid bulk modulus and density. Figure final1a-ann shows these effects clearly.
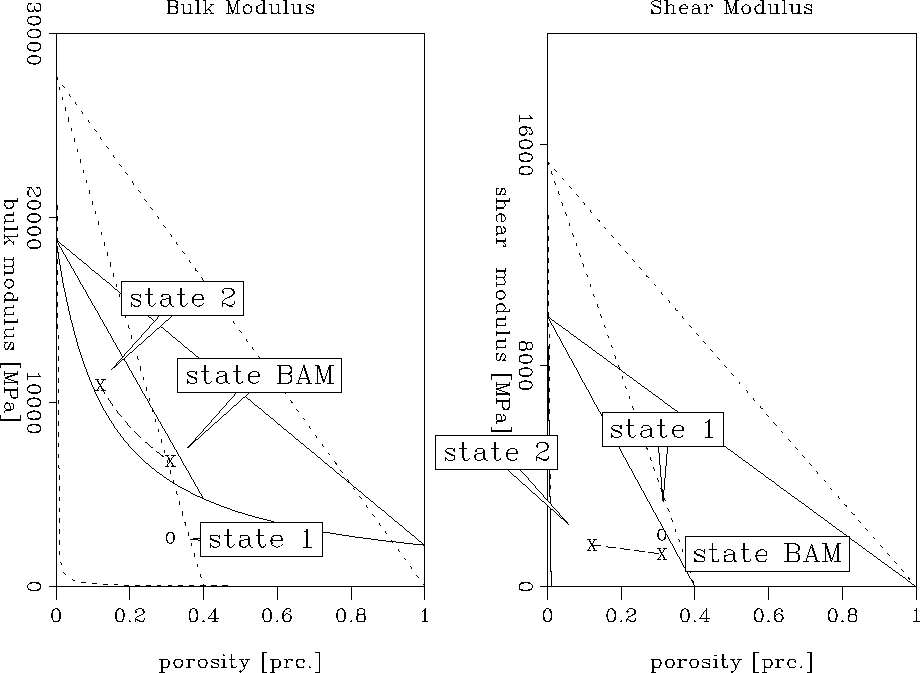 |
The resulting bulk modulus, marked as state 2 in Figure final1a-ann,
is significantly higher than the old bulk modulus, marked as state 1,
indicating that the new sediment structure has much lower compressibility.
State
BAM represents the modulus obtained by transforming the gas model using the
BAM method without changing the porosity. The shear modulus of the hydrate
structure has slightly decreased with regard to the modulus of the gas
structure. The velocities obtained from these elastic moduli are :
vp = 2.55 km/s
vs = 0.87 km/s
Comparing these velocities with those of the initial gas model (vp = 1.6 km/s,
vs = 1.0 km/s) shows that the P-wave velocity increased considerably while
the S-wave velocity decreased slightly. This velocity trend resembles the
one obtained from the seismic study by Ecker and Lumley .
However, although the increase in P-wave velocity is in good agreement with
the actually observed one, the model did not succeed in reproducing an S-wave
velocity ratio of approximately 2:1 from gas to hydrates.
Thus, adding the hydrate to the rock matrix and
hence decreasing the porosity of the resulting water-saturated composite
predicts the correct velocity trend but its effect on the S-wave velocity is
not significant enough.
Change in stiffness
Assuming that the hydrate becomes part of the rock matrix during its formation, fracturing of the composite is possible due to the solidification of the methane. This would introduce crack-like and compliant pores resulting in a softening of the hydrate bearing sediments. To realize this model, the initial gas model of 69% mineral and 31% gas/water mixture is again transformed into 88% mineral containing 22% hydrate and 12% water filling the pores. In contrast to the previous model in which no fracturing of the rock was assumed, the stiffness of the hydrate bearing sediments is changed by assuming that the fracturing causes a 50% softening of the rock. The properties of the pure mineral and the pore filling are not changed by a softening of the rock and are thus the same as in the previous model shown in Table 3. The result of this modeling approach can be seen in Figure final1b-ann.
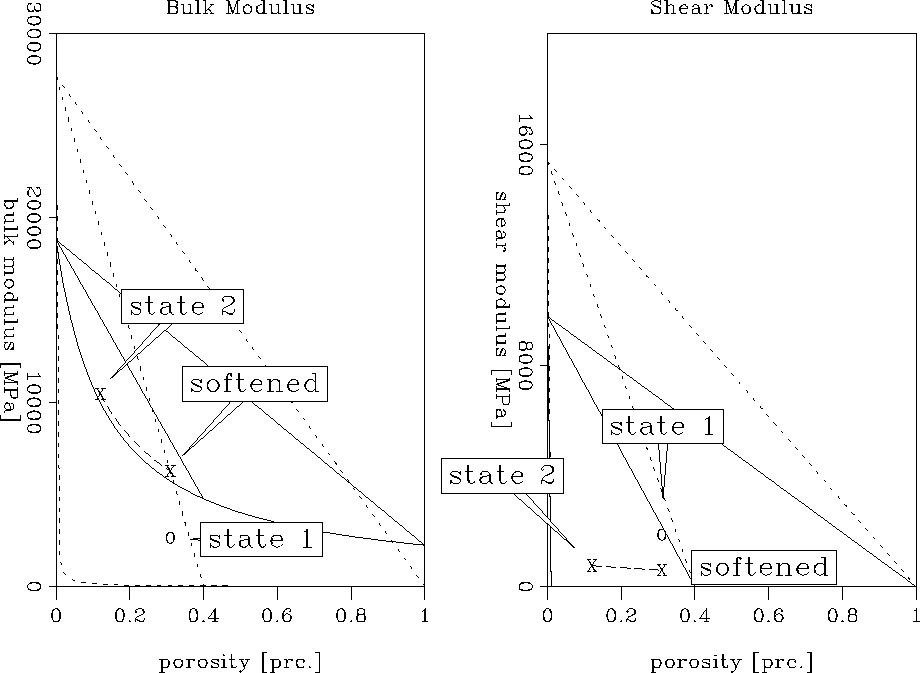 |
The moduli obtained with this model are again
marked as state 2 in Figure final1b-ann, and those obtained from the
initial model are marked as state 1. ``Softened'' represents the position after
application of the BAM method and 50% softening. As in the model without
fracturing, the bulk modulus increased significantly with respect to the
initial model. On the other hand, the shear modulus shows a more notable
than before. The bulk and shear moduli of this hydrate model yield
the following velocities in the hydrate bearing sediments:
vp = 2.40 km/s
vs = 0.62 km/s
A comparison with those values obtained without softening the sediments shows that the additional fracturing caused the P-wave velocity to decrease slightly from 2.55 km/s to 2.4 km/s. An even larger effect can be observed on the S-wave velocity which decreased from 0.87 km/s to 0.62 km/s. This indicates that further softening of the pores would result in an even more decreased S-wave velocity of the hydrate structure. Apparently, a decrease similar to the one determined from the seismic data (1.1 km/s in the gas, 0.5 km/s in the hydrate) is possible in this way. However, further softening would also introduce a more pronounced decrease in the P-wave velocity compared to the one obtained without softening. Therefore, this model provides a good explanation for the observed anomalous decrease in S-wave velocity, but lacks the simultaneously large increase in P-wave velocity. Another possible hydrate structure has to exist which would leave the S-wave velocity decreased by fracturing approximately constant but would again increase the P-wave velocity. As shown in a previous section, the additional formation of ice can be expected to have such an effect. This assumption is investigated in the following hydrate model.
Change in stiffness and ice formation
This modeling approach explores the effects of additional ice formation
at the gas-hydrate transition zone, caused by temperature conditions
around the freezing point of water.
During the formation of hydrate and ice, they become both part
of the mineral and cause fracturing of the rock. Presuming that 50% of the
water in the pore space freezes, a sediment model containing 94% mineral
and 6% pores filled with water is constructed.
The mineral is composed of 73% shaly
sands, 20% hydrates and 7% ice. The initial model on the other hand contained
69% mineral and 31% pores filled with a gas/water mixture. Due to the
additional formation of ice, the properties of the pure mineral have changed
with regard to the previous model without ice.
As the model still assumes 100% water
saturation, the properties of the pore filling did not changed.
The new mineral is characterized by:
Kmin = 17800 MPa
![]() = 9100 MPa
= 9100 MPa
![]() = 2043 kg/m3
= 2043 kg/m3
The addition of ice to the pure mineral has decreased its elastic properties
even further. The effect of the ice formation on the elastic moduli can be
seen in Figure final2b-ann.
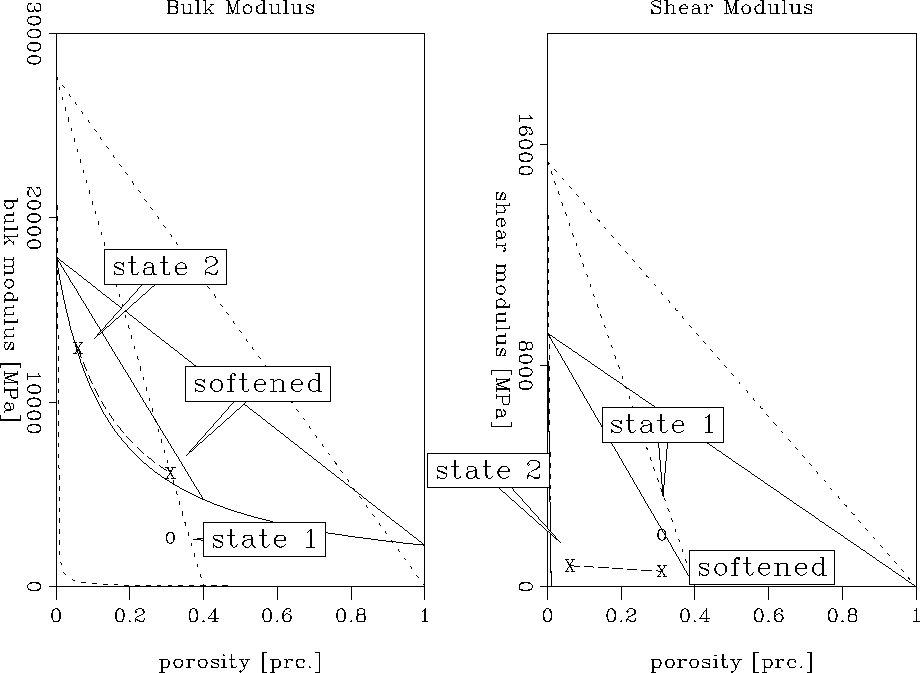 |
As before, state 1 represents the moduli of the gas/water saturated sediments
while state 2 marks the moduli of the hydrate structure after interpolation
to a porosity of 6%. "Softened" describes
the position after transformation of the initial model using the BAM method
and softening of the pores. It is obvious that this model results in the
same velocity behavior as the previous model without ice. The bulk modulus
has increased considerably while the shear modulus in the hydrate structure
decreased. The actual velocities that can be determined are:
vp = 2.65 km/s
vs = 0.62 km/s
A comparison of these values with those obtained without the presence of
ice shows that the P-wave velocity has increased while the S-wave velocity
remained constant. Figure comp-ann shows this behavior clearly.
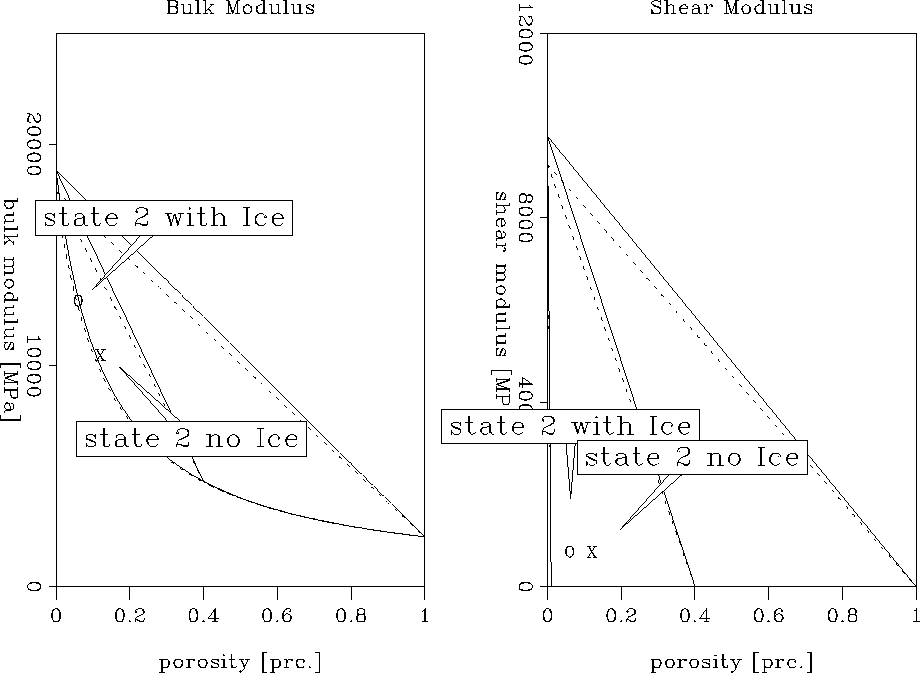 |
Consequently, the P-wave velocity which becomes too low by softening the pores can be increased again by the addition of ice to the mineral. As predicted, there is no notable effect on the S-wave velocity. The obtained velocities are in good agreement with those obtained by the seismic analysis (vp = 2.5 km/s, vs = 0.5 km/s) and an even better agreement could be achieved by further softening of the pores. Thus, assuming temperature conditions close to the freezing point of water and fracturing during the hydrate and ice formation seems to be a reasonable model for the hydrate structure at the Blake Outer Ridge.
However, a comparison of the actual numbers should be done very carefully due to the fact that the initial shaly sand model was determined only in first approximation. Based on the high clay content present in the sediments of the Blake Outer Ridge, a relatively high uncertainty is introduced into the elastic moduli and velocities of the initial gas structure. A different starting model might thus result in different absolute velocity numbers in the hydrate structures. Furthermore, it has to be considered that the velocities determined by Ecker and Lumley might also have some uncertainties.
CONCLUSIONS
The properties of different hydrate structures were evaluated in an attempt to explain the seismic velocities determined at the Blake Outer Ridge. All results were related to an initial gas/water saturated rock model containing 60% shaly sands and a porosity of 31%.
The analysis showed that the P-wave velocity in sediments containing hydrates increases significantly independently from the apparent hydrate structure. The S-wave velocity on the other hand is extremely dependent on the way the hydrate forms and affects the rock matrix. The assumption of a so-called ``slush'' model could not reproduce the required considerable decrease in S-wave velocity at the transition from gas to hydrate. Presuming, however, that the hydrate becomes part of the mineral and causes softening of the pores due to induced fracturing, the S-wave velocity in the hydrate layer could be decreased significantly. Simultaneously, fracturing induced a slightly lower P-wave velocity in the hydrate structure. It was therefore necessary to assume temperature conditions close to the freezing point of water to allow the additional formation of ice. This resulted in an increase of the P-wave velocity while the S-wave velocity remained constant, creating the desired P- to S-wave ratio.
It can be concluded that a hydrate model which adds hydrate and ice
to the mineral
and softens the pores by fracturing seems to be a reasonable assumption for
the hydrate bearing sediments of the Blake Outer Ridge based on the given
initial model. The high clay concentration at the Blake Outer Ridge introduced,
however, high uncertainties into this initial model due to the still quite
speculative properties of clay. Thus, the effects of different clay
concentration and properties as well as different gas concentration in the
initial gas structure have to be evaluated further.
I would like to thank Gary Mavko, Jack Dvorkin and David Lumley for many helpful discussions and suggestions.
[SEP,MISC]
![[*]](http://sepwww.stanford.edu/latex2html/prev_gr.gif)