

Next: About this document ...
Up: Abma and Claerbout: Lateral
Previous: ACKNOWLEDGMENT
- Canales, L. L., 1984, Random noise reduction: 54th Annual Internat. Mtg., Soc. Expl. Geophys., Expanded Abstracts, Session: S10.1.
-
- Chase, M. K., 1992, Random noise reduction by 3-D spatial prediction filtering: 62nd Annual Internat. Mtg., Soc. Expl. Geophys., Expanded Abstracts, Session: SP3.4.
-
- Claerbout, J. F., 1992a, Earth
 oundings
  nalysis: Processing versus
  nversion: Blackwell Scientific Publications.
-
- Claerbout, J. F., 1992b, Information from smiles: mono-plane-annihilator weighted regression: Stanford Exploration Project-73, 409-420.
-
- Gulunay, N., Sudhakar, V., Gerrard, C., and Monk, D., 1993, Prediction filtering for 3-D post-stack data: Preprint of an article submitted for the 63rd Annual Internat. Mtg., Soc. Expl. Geophys., Expanded Abstracts.
-
- Gulunay, N., 1986, FXDECON and complex Wiener prediction filter: 56th Annual Internat. Mtg., Soc. Expl. Geophys., Expanded Abstracts, Session: POS2.10.
-
yplanesld
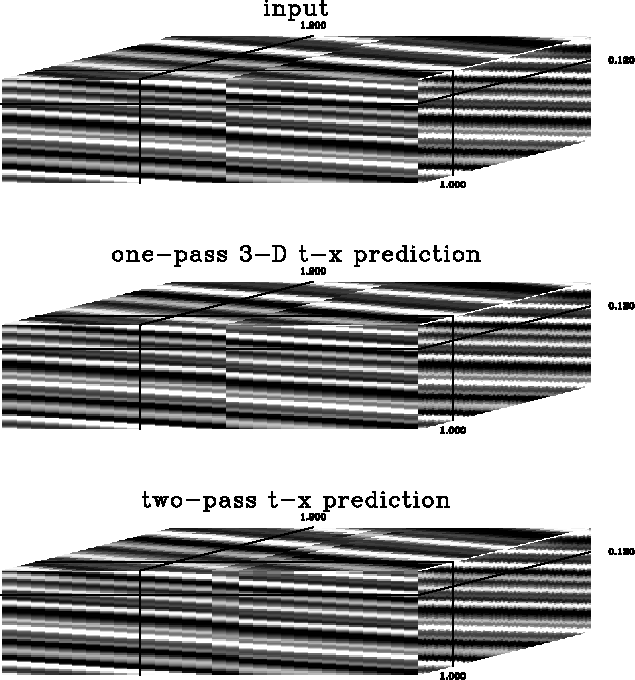
Figure 4
A comparison of smearing on with one- and two-pass t-x prediction.
The top cube is the input,
the middle cube is the result of a one-pass three-dimensional t-x prediction,
and the bottom cube is the result of two passes of one-dimensional
t-x prediction in the inline and crossline directions.
The one-pass result shows no smearing of the fault; the two-pass result
shows a smeared fault image.


Arcoorig
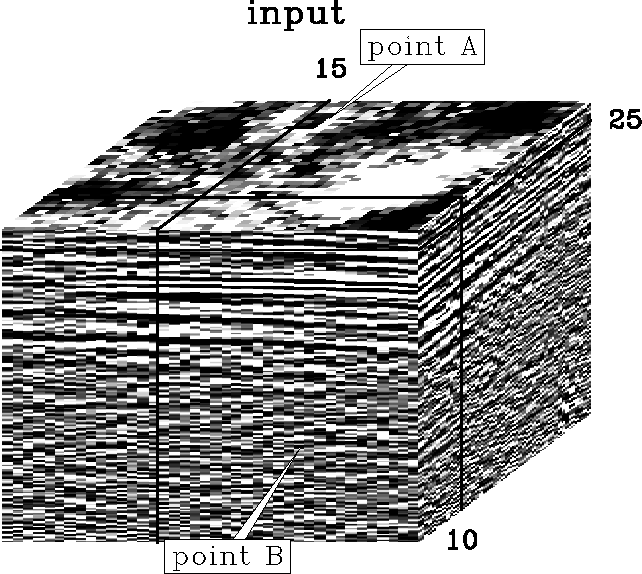
Figure 5
The input to the t-x and f-x predictions.
A significant amount of noise is seen here.


Arcofx2d
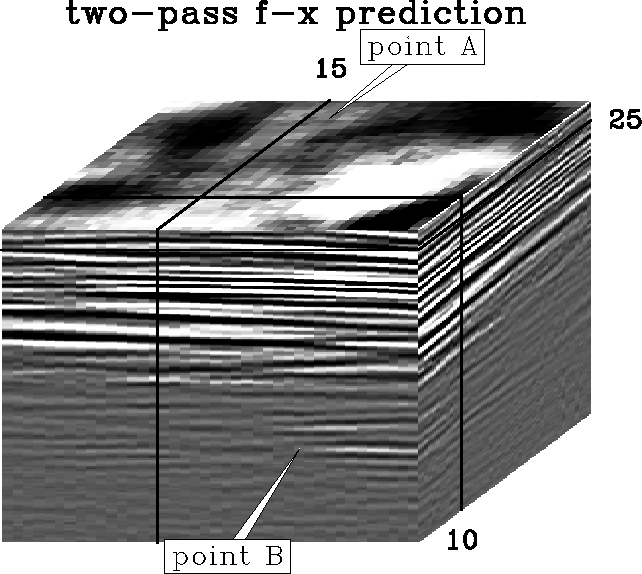
Figure 6
The result of two passes of two-dimensional f-x prediction processing.
While this result is an improvement over the input, some of the details
is seen to be lost when compared to the three-dimensional f-x prediction.


Arcofx3d
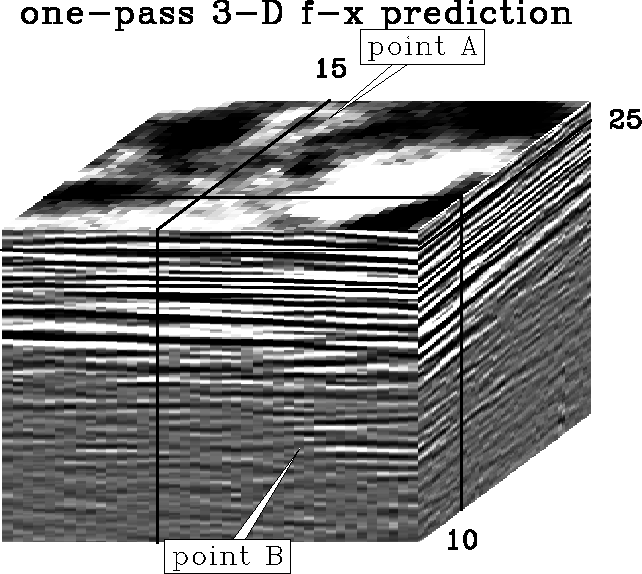
Figure 7
The result of three-dimensional f-x prediction processing.
This result preserves the details lost in the two-dimensional f-x prediction.


Arcotx2d
Figure 8
The result of two passes of two-dimensional t-x prediction processing.
While this result is an improvement over the input, some of the details
is seen to be lost when compared to the three-dimensional t-x prediction.
More noise has been attenuated than with the two-dimensional f-x prediction.


Arcotx3d
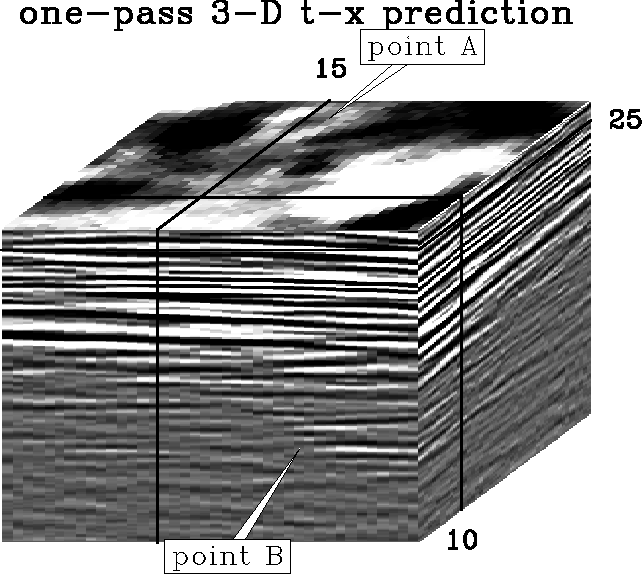
Figure 9
The result of three-dimensional t-x prediction processing.
This result preserves the details lost in the two-dimensional t-x prediction.


Next: About this document ...
Up: Abma and Claerbout: Lateral
Previous: ACKNOWLEDGMENT
Stanford Exploration Project
11/16/1997
