![[*]](http://sepwww.stanford.edu/latex2html/cross_ref_motif.gif) .
.
In the first preprocessing step, the raw data were corrected for constant
velocity spherical divergence by multiplying each trace with a time-variant
amplitude scale function of the form A(t)=t. Following the divergence
correction, we performed a normal moveout correction with an initial estimate
of the best stacking velocity function. A windowed section of the first CMP
gather can be seen in Figure ![[*]](http://sepwww.stanford.edu/latex2html/cross_ref_motif.gif) .
.
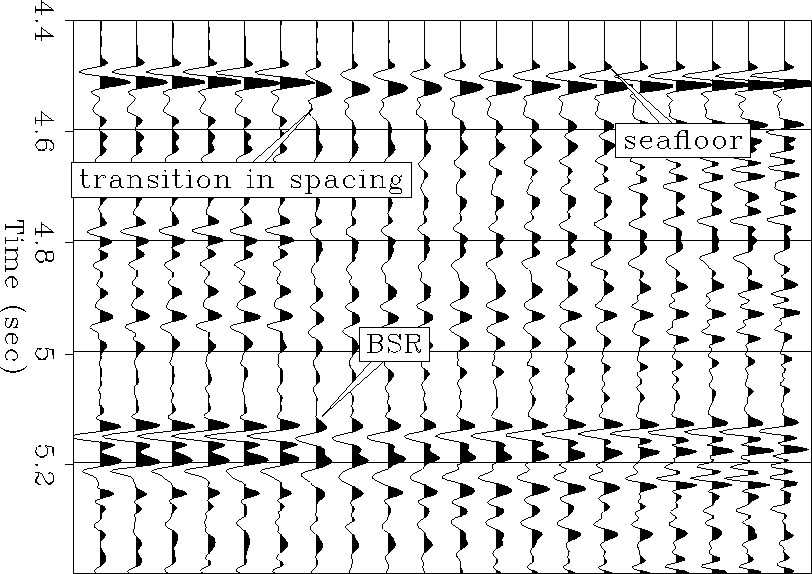 |
A significant change in shape and amplitude of the source wavelet is
visible at the transition zone between the 50 m and 100 m group spacings, where
the wavelet exhibits very low frequency content and weak amplitude. In the
direction of the near offsets (to the right in Figure ![[*]](http://sepwww.stanford.edu/latex2html/cross_ref_motif.gif) ), the
wavelet sharpens again and regains its large amplitude. These waveform shape
and amplitude changes with offset can seriously degrade any subsequent AVO
analysis. In order to regularize the wavelet as much as possible, a single
trace source wavelet deconvolution before NMO correction was performed.
Although the application of single trace, as opposed to surface-consistent,
deconvolution can result in undesired changes in amplitude and waveform, the
Blake Outer Ridge seismic data were of high enough quality that single trace
deconvolution with careful quality control gave very consistent results. The
deconvolved data were then bandpass filtered to the original data bandwidth
to remove spurious deconvolutional high frequency noise, and again NMO
corrected.
After having accounted for the change of the waveform shape at the
transition zone, the amplitude change also required compensation. In order to
do this, two main assumptions were made. First, it was assumed that an offset-dependent rather than an angle-dependent amplitude correction was sufficient,
since the difference between the maximal angle of incidence at the seafloor
(33) and the BSR reflection (30) is negligibly small. Second, we
assumed a functional form for the AVO response of the seafloor reflection,
based on equal positive P and S impedance contrasts, adjusted here to
0.4 respectively, via linearized
Zoeppritz modeling. Based on these assumptions, the amplitude calibration was
performed by scaling each trace to the seabottom amplitude to match the
predicted seafloor AVO, as a function of offset. Figure
), the
wavelet sharpens again and regains its large amplitude. These waveform shape
and amplitude changes with offset can seriously degrade any subsequent AVO
analysis. In order to regularize the wavelet as much as possible, a single
trace source wavelet deconvolution before NMO correction was performed.
Although the application of single trace, as opposed to surface-consistent,
deconvolution can result in undesired changes in amplitude and waveform, the
Blake Outer Ridge seismic data were of high enough quality that single trace
deconvolution with careful quality control gave very consistent results. The
deconvolved data were then bandpass filtered to the original data bandwidth
to remove spurious deconvolutional high frequency noise, and again NMO
corrected.
After having accounted for the change of the waveform shape at the
transition zone, the amplitude change also required compensation. In order to
do this, two main assumptions were made. First, it was assumed that an offset-dependent rather than an angle-dependent amplitude correction was sufficient,
since the difference between the maximal angle of incidence at the seafloor
(33) and the BSR reflection (30) is negligibly small. Second, we
assumed a functional form for the AVO response of the seafloor reflection,
based on equal positive P and S impedance contrasts, adjusted here to
0.4 respectively, via linearized
Zoeppritz modeling. Based on these assumptions, the amplitude calibration was
performed by scaling each trace to the seabottom amplitude to match the
predicted seafloor AVO, as a function of offset. Figure ![[*]](http://sepwww.stanford.edu/latex2html/cross_ref_motif.gif) shows a windowed CMP section after the deconvolution and amplitude corrections.
shows a windowed CMP section after the deconvolution and amplitude corrections.
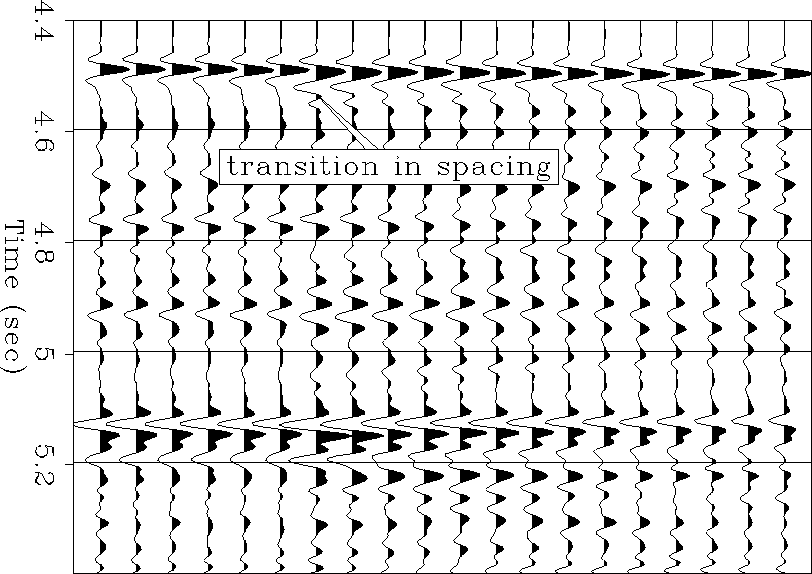 |
Comparing this result with the previous figure, the improvement of the waveforms is obvious. There are only small variations in the shape of the wavelet left and the amplitudes are physically consistent across the entire offset range.
A linear interpolation at the near offsets was used to even the group spacings
to 50 m at each offset and thus eliminated the traveltime
kink introduced by
the nonlinear streamer. After applying an inverse NMO correction to the
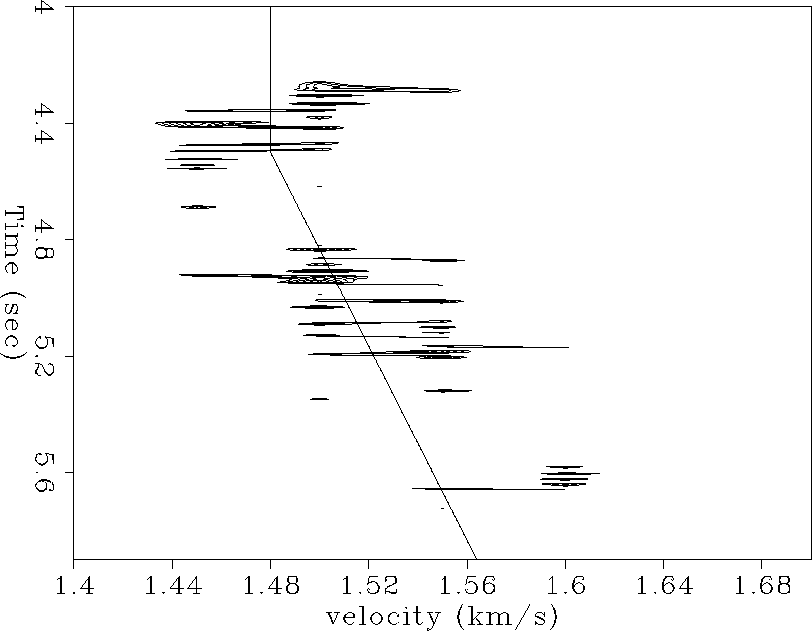
interpolated data, a high resolution NMO stacking velocity analysis
was performed. The velocity scans showed a nearly linear rms velocity
function at each CMP, which varies as a function of depth below the seafloor
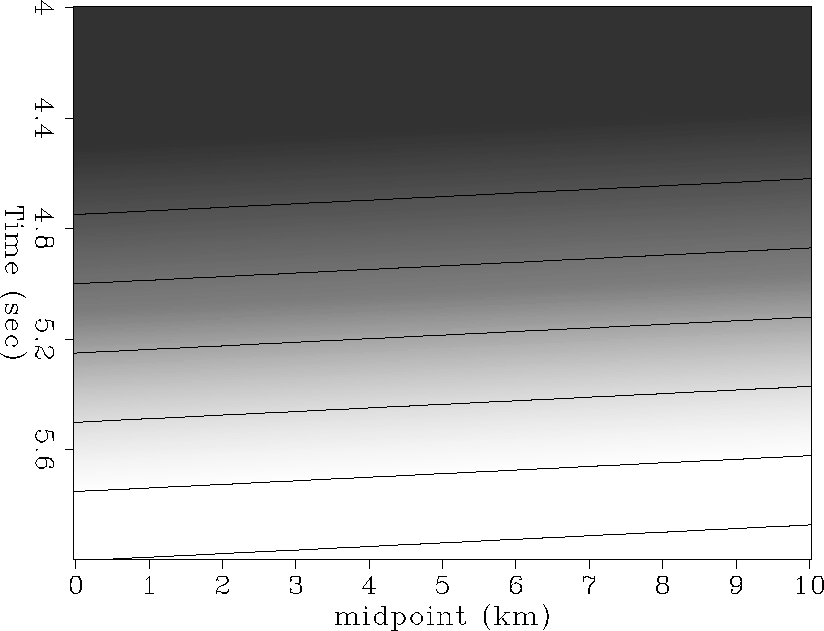
(Figure ![[*]](http://sepwww.stanford.edu/latex2html/cross_ref_motif.gif) ). A 2-D rms velocity model was built based on the velocity
scan information along the line. It assumes a water velocity of 1.48 km/s and
increases linearly with depth with a constant gradient of 0.06 km/s/s (Figure
). A 2-D rms velocity model was built based on the velocity
scan information along the line. It assumes a water velocity of 1.48 km/s and
increases linearly with depth with a constant gradient of 0.06 km/s/s (Figure
![[*]](http://sepwww.stanford.edu/latex2html/cross_ref_motif.gif) ).
).
 |
 |
After having derived a good stacking velocity model for the data, they were
processed again by using the new velocity model. Since it is essential for the
subsequent impedance contrast estimation that the reflector moveout is very
flat after NMO correction, an additional static shift was applied before the
amplitude scaling to correct for some small non-hyperbolic offset-dependent
moveout in the CMP gathers. The final deconvolved, NMO, static, amplitude
and group spacing corrected data are shown in Figure ![[*]](http://sepwww.stanford.edu/latex2html/cross_ref_motif.gif) .
.
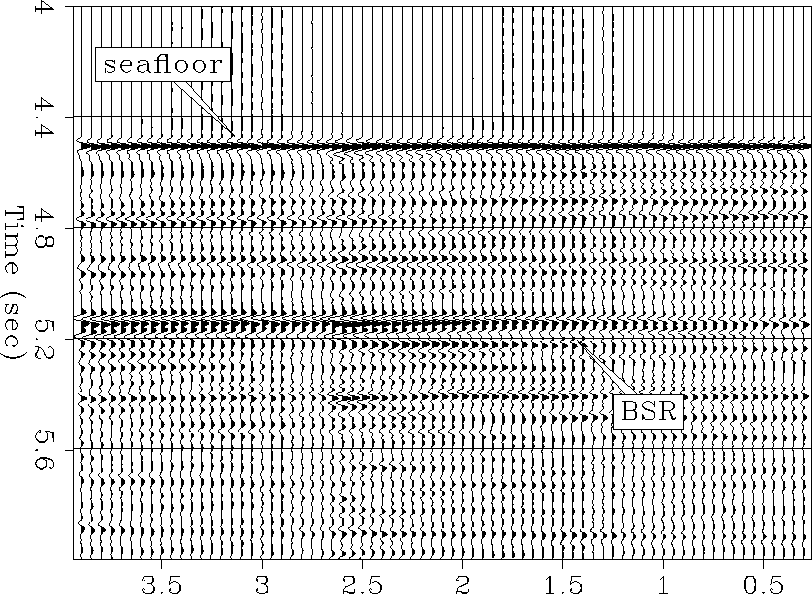 |
This figure clearly indicates the nearly constant AVO amplitudes of
the seafloor
reflection and the increasing negative amplitudes with increasing offset of
the
hydrate reflection. This result can be compared with the theoretical AVO curves
for hydrate over sediment and hydrate over gas which were shown in
Figure ![[*]](http://sepwww.stanford.edu/latex2html/cross_ref_motif.gif) .
The comparison of the observed behavior with the predicted one already
suggests that there might be free gas present beneath the bottom of the hydrate
stability field.
.
The comparison of the observed behavior with the predicted one already
suggests that there might be free gas present beneath the bottom of the hydrate
stability field.