![[*]](http://sepwww.stanford.edu/latex2html/cross_ref_motif.gif) ).
).
The seismic data used for this study consist of 201 CMP gathers recorded
along the
Blake Outer Ridge with a non-linear streamer resulting in a 100 m group spacing
at the near offset traces and a 50 m group spacing at the far offset traces
(Figure ![[*]](http://sepwww.stanford.edu/latex2html/cross_ref_motif.gif) ).
).
 |
 |
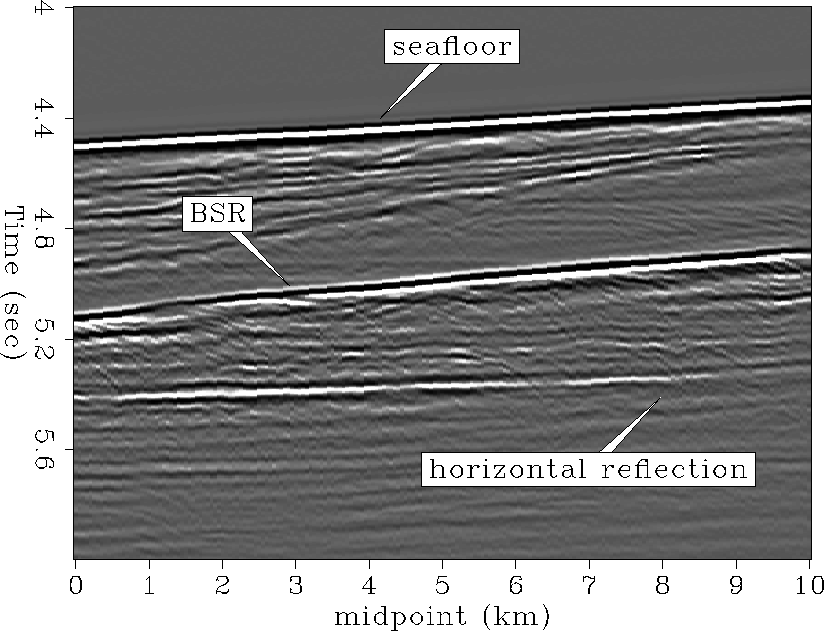
The seafloor reflection occurs at about 4.4 seconds, indicating a water depth
of over 3 km, and decreases in depth gradually along the line (Figures
![[*]](http://sepwww.stanford.edu/latex2html/cross_ref_motif.gif) and
and ![[*]](http://sepwww.stanford.edu/latex2html/cross_ref_motif.gif) ). It is followed by a strong bottom
simulating reflection at approximately 5.2 seconds vertical traveltime. A
fairly bright ``flat spot'' reflection is apparent beneath the BSR at 5.4
seconds, which does not parallel the seafloor or BSR reflection events.
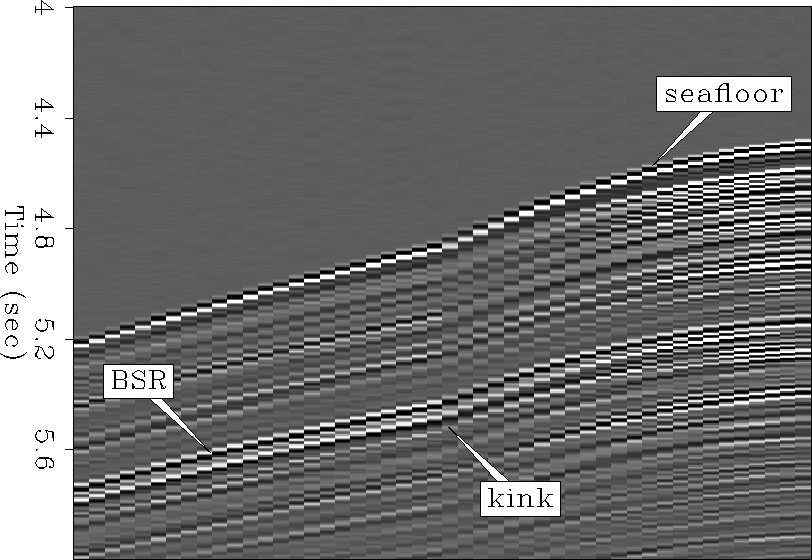
Examining the raw prestack data, a traveltime kink is very striking in all
reflections near the central offset of the CMP gathers. This kink occurs
exactly at the transition zone between the nonlinear cable group
spacing of 100 m at the near offsets, and 50 m group spacing at the far
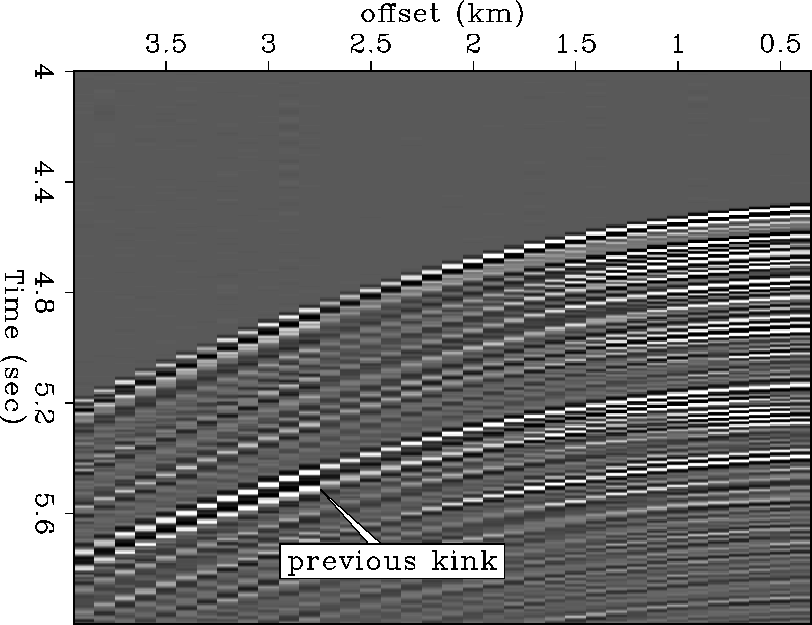
offsets. Adding the far offset traces in pairs to simulate a constant cable
group spacing of 100 m at all offsets eliminates the traveltime kink in the
data (Figure
). It is followed by a strong bottom
simulating reflection at approximately 5.2 seconds vertical traveltime. A
fairly bright ``flat spot'' reflection is apparent beneath the BSR at 5.4
seconds, which does not parallel the seafloor or BSR reflection events.
Examining the raw prestack data, a traveltime kink is very striking in all
reflections near the central offset of the CMP gathers. This kink occurs
exactly at the transition zone between the nonlinear cable group
spacing of 100 m at the near offsets, and 50 m group spacing at the far
offsets. Adding the far offset traces in pairs to simulate a constant cable
group spacing of 100 m at all offsets eliminates the traveltime kink in the
data (Figure ![[*]](http://sepwww.stanford.edu/latex2html/cross_ref_motif.gif) ), but causes adverse waveform and amplitude changes
with offset.
), but causes adverse waveform and amplitude changes
with offset.
 |
The group-corrected data have less spatial resolution than the original data,
based on a decrease from 48 to 36 traces.
Furthermore, the group summation causes
a significant loss in temporal frequency content at the far offsets, due to
spatial averaging of moveout delayed reflections across a twice longer
effective group array. One possibility to compensate for this low frequency
group array response is to filter (deconvolve) the far offset data in the k-x
domain. However, the decreased number of summed far offset traces
result in a very short data series, which makes accurate spectral estimates
and the application of spatial deconvolutional filters difficult. Another
possibility to account for this frequency loss is to deconvolve the far offsets
as function of the Snell parameter p in the slant stack domain.
Unfortunately, the small number of traces tends to introduce large edge
effects in the slant stack spectrum. These edge
effects could be minimized by using a least-squares slant stack which, however,
would smear the notches in the ![]() spectrum, and the resulting
deconvolution would overemphasize those portions of the spectrum. Therefore, it
seems unreasonable to correct the raw data for the different group spacings by
summing the far offset traces in pairs. A simple linear interpolation of the
near offset traces after NMO, with source wavelet deconvolution and amplitude
calibration to compensate for the group array response appears to be a better
method for suppressing the nonlinear cable effects.
spectrum, and the resulting
deconvolution would overemphasize those portions of the spectrum. Therefore, it
seems unreasonable to correct the raw data for the different group spacings by
summing the far offset traces in pairs. A simple linear interpolation of the
near offset traces after NMO, with source wavelet deconvolution and amplitude
calibration to compensate for the group array response appears to be a better
method for suppressing the nonlinear cable effects.